WHERE DOES YOU CNS DRUG ACTUALLY GO IN THE BRAIN?

Jacob Hecksher-Sørensen
For any CNS drug discovery program, one question sits beneath all the others: where does my molecule actually go once it reaches the brain? You can have the right target, the right potency and a clean PK profile, but if your compound never reaches the regions where it needs to act, or accumulates where it should not, the program is in trouble.
In this episode of the Vibraint Product Series, neuroscientist Harry Salt sat down with Jacob Hecksher-Sørensen, CEO and co-founder of Vibraint, to discuss how whole brain imaging answers this question. Below we pull out the key themes and show how you can run these studies on the LS-Journey™ platform.
LISTEN TO THE EPISODE
YouTube
WHAT IS WHOLE BRAIN DRUG BIODISTRIBUTION IMAGING?
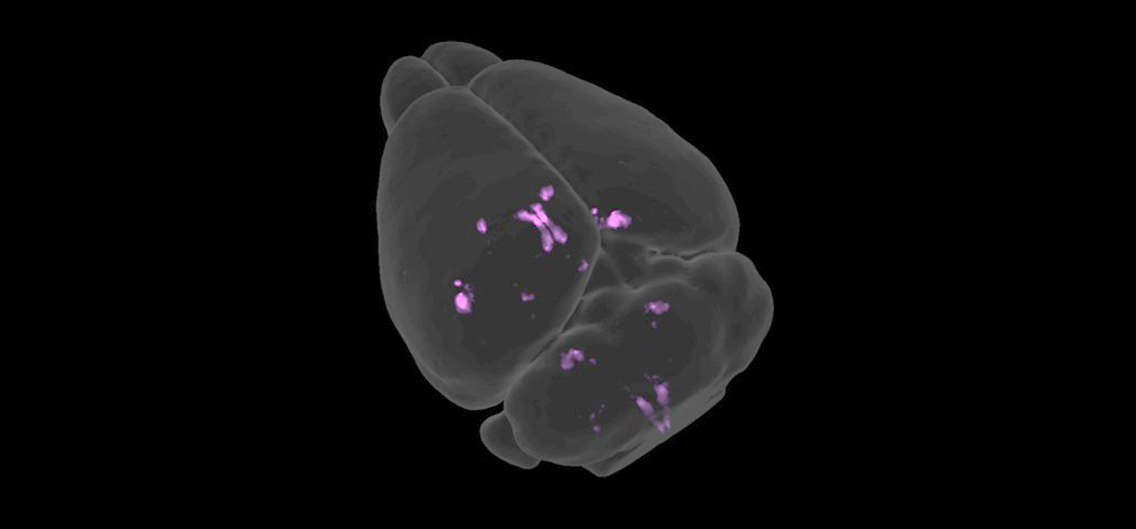
Whole brain drug biodistribution imaging shows you exactly where a compound distributes across the entire brain in 3D. A fluorophore is conjugated to your drug, protein or compound, injected into a mouse, and allowed to distribute. The brain is then cleared, imaged with light sheet fluorescence microscopy, and the fluorescent signal is quantified region by region across all 800+ anatomical regions.
Interestingly, this was one of the very first applications of whole brain imaging. Before it was possible to label a whole brain with antibodies, the approach was simply to tag a compound with a fluorophore and trace where it went. The first molecule studied this way was an early GLP-1 analogue, the predecessor of today's blockbuster obesity and diabetes drugs. Because GLP-1 was known to reduce food intake, the obvious question was whether the labelled peptide reached the appetite-controlling neurons it was thought to act on, and whether more efficacious peptides distributed differently. That single question captures the heart of biodistribution imaging.
HOW IS FLUORESCENT DRUG DISTRIBUTION QUANTIFIED?
The readout is fluorescence intensity, measured per anatomical region and compared between a control group and treated groups. On LS-Journey™, every region is segmented automatically using AI-assisted CCF atlas registration, so you capture signal everywhere the drug goes rather than committing to a few regions in advance and missing everything in between.
Two design points matter here. First, injecting many millions of fluorophore-labelled molecules genuinely raises tissue fluorescence, so a PBS-only control reads lower simply because less fluorophore is present; this has to be built into the design. Second, for peptides, the cleanest control is a receptor knockout. The drug still circulates, but the region of interest does not label because the receptor is absent, giving crisp, interpretable evidence of where target engagement actually happens.
"Wherever you engage the receptor of the drug, it will be in the same place across animals. The statistical maps give you a very precise understanding of exactly where your drug is working."
Jacob Hecksher-Sørensen, Co-founder and CEO, Vibraint
WHICH DRUG CLASSES WORK BEST?
The molecule class shapes the study design. Peptides are convenient and clean; antibodies are forgiving; nucleic acids are the frontier. Here is how they compare.
BEST FIT
Peptides
Small enough to synthesise with a fluorophore directly. Needs assay development to confirm binding after conjugation, with receptor knockout and competitive displacement as rigorous controls. Validated across GLP-1, GIP, glucagon and multi-agonist analogues.
WELL SUITED
Antibodies & brain shuttles
Large enough that a fluorophore rarely disturbs their properties. Human therapeutic antibodies can be detected with a species-specific secondary, so labelling may not be needed. The brain shuttle effect is quantified brain-wide in a single experiment.
EMERGING
RNA, DNA & AAV
Uptake mechanisms are general rather than receptor-specific, so there is no simple biological control. Labelling with both a hydrophilic and hydrophobic fluorophore helps confirm the fluorophore is not driving distribution. AAV transduction mapping matters given off-target toxicity considerations.
HOW DOES IMAGING MAP BLOOD BRAIN BARRIER PASSAGE?
Large molecules are not supposed to cross the blood brain barrier. There are a few naturally leaky regions, the circumventricular organs such as the area postrema and the median eminence around the arcuate nucleus, where the brain senses peripheral signals. But for diseases like Alzheimer's or Parkinson's, where pathology is spread throughout the brain, reaching those distributed targets is genuinely hard.
This is where brain shuttles have transformed the field. By binding transferrin or other transporters in the vasculature, these constructs are actively pumped across the barrier into the parenchyma. The effect on distribution can be dramatic, and clinical trials of shuttle-equipped Alzheimer's drugs are now showing real promise. Whole brain imaging is uniquely able to demonstrate and quantify this effect, often with strikingly low animal numbers because the result is so clean. A subtler observation worth keeping in mind: peptides engineered with fatty acids to bind plasma proteins like albumin may piggyback on those proteins to reach regions that simple PK would not predict.
CONFIRMING TARGET ENGAGEMENT, NOT JUST DISTRIBUTION
Reaching a region is necessary but not sufficient; you also want evidence the drug is doing something once it arrives. LS-Journey™ studies can extend toward target engagement in several ways: overlaying drug signal with receptor expression to confirm the drug accumulates where the receptor is, removing the receptor and confirming the signal disappears, or staining for downstream phosphorylation events that show the receptor was actually activated. In an Alzheimer's context, you can ask whether a shuttle-equipped antibody binds pathology across the barrier, and whether the shuttle lets you achieve the same engagement at a lower dose.
WHY THIS ACCELERATES A DRUG DISCOVERY PROGRAM
Most CNS side effects, the nausea, aversion and other unwanted outcomes, arise from activating neuron populations you did not intend to hit. Knowing exactly where your molecule goes therefore informs both efficacy and safety. If you have ten candidate compounds, a whole brain biodistribution study lets you select the one that reaches the target most efficiently, or kill a program early when the distribution is wrong, before larger investments are made.
A standout feature is the statistical map. Because many brains from one group can be overlaid, you get a group-level statistical representation rather than a single noisy sample. A molecule lodged in a blood vessel sits in a different place in every mouse and washes out of the average; genuine receptor engagement appears in the same place across every animal and stands out with high confidence. This is exactly the kind of decision-grade evidence regulators expect. Notably, GLP-1 biodistribution data of this type contributed to the NDA qualification of Saxenda, the first FDA-approved obesity drug.
RUN YOUR STUDY USING LS-JOURNEY™
With LS-Journey™, your fluorescence-intensity data is quantified across all 800+ brain regions, delivered as statistical maps with full group-level analysis, and made fully interactive in 3D and 2D on CNS-Voyager™. Studies can be acute or chronic, the latter revealing how distribution shifts as receptors downregulate over time. Because LS-Journey™ is modular, you can also send in externally generated light sheet data for AI-assisted analysis and upload to CNS-Voyager™.
WHAT YOU RECEIVE
- Brain-wide fluorescence intensity maps
- Voxel- and region-wise statistical maps
- Per-region intensity tables (export)
- Receptor co-registration in CNS-Voyager™
- IND/NDA-enabling reports on request
A mouse is never a human, and these data cannot stand alone. But run early, whole brain biodistribution gives you the clearest possible view of where your CNS molecule goes, why it goes there, and whether it engages its target.
FREQUENTLY ASKED QUESTIONS
Can biodistribution imaging be used for IND or NDA submissions?
Yes. Whole brain GLP-1 distribution data generated by Vibraint's founders was used to support the NDA qualification of Saxenda, the first FDA-approved obesity drug. IND and NDA-enabling reports formatted for FDA and EMA submissions are available on request for any LS-Journey™ study.
What controls does a biodistribution study need?
For peptides, a receptor knockout is the most rigorous control, with competitive pre-treatment using unlabelled peptide as an orthogonal option. For antibodies, a species-matched isotype control or a with and without shuttle comparison. For RNA and DNA, multiple fluorophores of differing physicochemistry to separate molecule-driven from fluorophore-driven distribution. A vehicle-only group is always included to account for tissue autofluorescence.
How does light sheet biodistribution compare to PET imaging?
PET shares the inject-and-track logic but its spatial resolution in the mouse is too low to localise signal precisely. Light sheet biodistribution gives cellular-resolution 3D mapping that pins signal to specific brain nuclei. The two are complementary: PET confirms real-time dynamics while light sheet provides precise anatomical mapping, and studies using both provide the strongest combined evidence.
How many animals do I need?
It depends on the molecule and the effect size, but clean effects such as brain shuttle BBB crossing can often be demonstrated with small group sizes because the effetc of the shuttle is so strong and consistent across animals.
LISTEN TO THE FULL DISCUSSION
READY TO MAP YOUR COMPUND'S BRAIN WIDE SIGNATURE?
Talk to a Vibraint scientist about designing a whole-brain c-Fos imaging study for your programme — from first principles to delivered data on CNS-Voyager™