logo_text_black_bg

HOW TO GO FROM BEAUTIFUL 3D DATA TO QUANTIFIABLE ENDPOINTS?

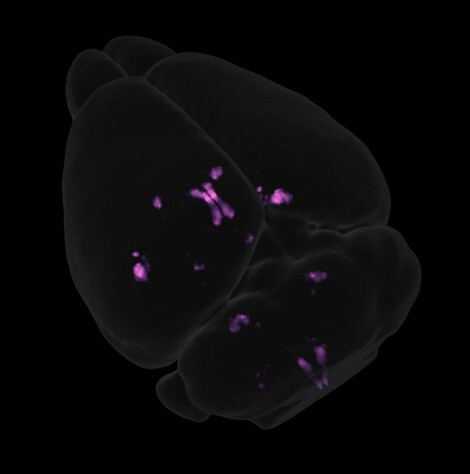
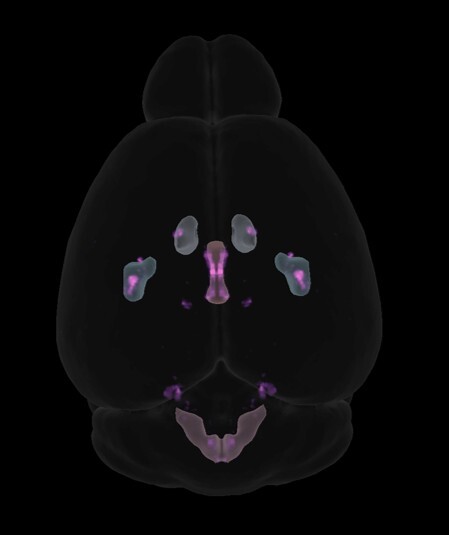
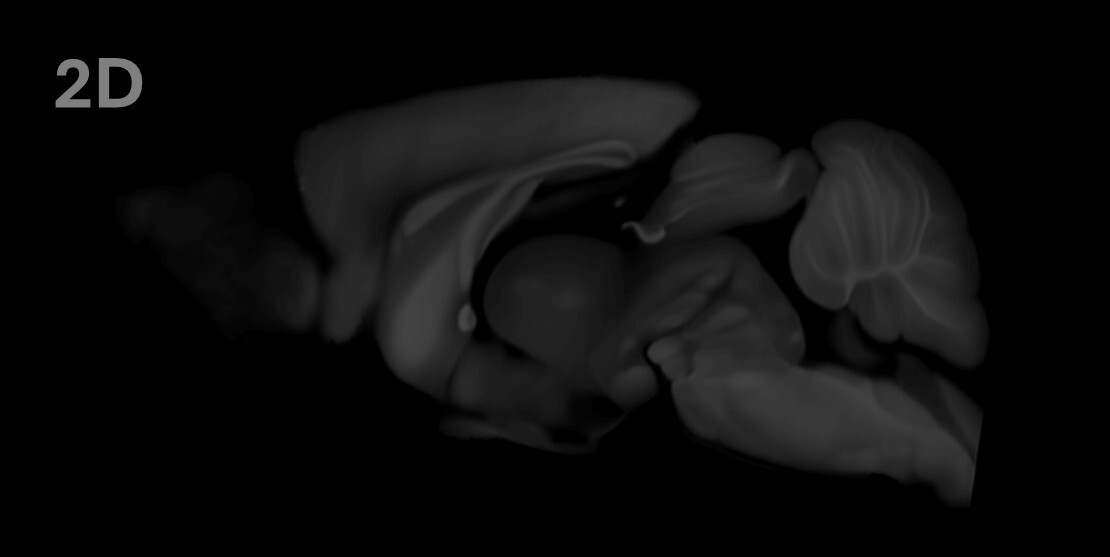
At Vibraint, we collaborate with leading neuroscientists across academia and industry to develop state-of-the-art tools for the analysis of LSFM whole-brain datasets. Following atlas registration and AI-assisted signal segmentation, results are seamlessly integrated into our interactive virtual brain viewer, CNS-Voyager™.

Below you will find some of the advantages offered by mapping data to a common coordinate framework (CCF)

At the bottom of the page you can download a 3D model of Vibraint's virtual mouse brain for spicing up your neuroscience presentations.

THE BOTTLENECK HAS SHIFTED FROM ACQUISITION TO ANALYSIS

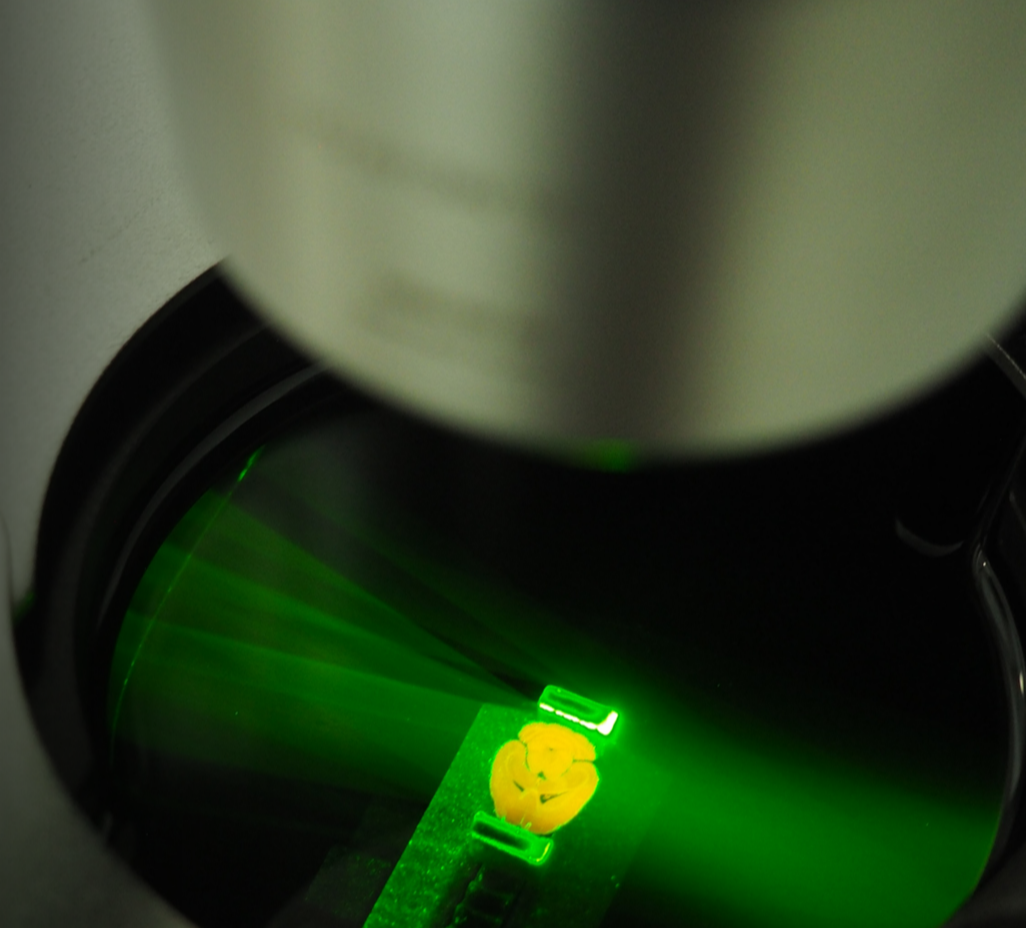
Light sheet microscopes are now accessible in core facilities, research departments, and pharmaceutical companies worldwide. Acquiring whole-brain 3D data is no longer the challenge it once was.

Analysing it is.

A single mouse brain scan generates 20 to 40 gigabytes of image data at standard resolution, and up to a terabyte at high resolution. Extracting reproducible, quantitative endpoints from this data requires specialized hardware, dedicated pipelines, and a team that combines neurobiology, imaging physics, and computational science. Most institutions do not have image analysts dedicated to brain analysis, and general-purpose data scientists need months to learn the domain.

Vibraint's image analysis module (LS-Journey™ Module 03) was built for exactly this scenario. Whether you image in-house or at a core facility, we analyse your data using our peer-reviewed Common Coordinate Framework, deep learning segmentation, and quality-controlled pipelines, and deliver your results interactively via CNS-Voyager™.

Sema-1

"Many laboratories can now afford to have the microscope in-house. Core facilities have them, even standalone research departments. But people really struggle with analysis. Not every institution has image analysts dedicated to brain analysis."

-Johanna Perens, Vibraint

VIBRAINT PRODUCT SERIES - EPISODE 3

Image Analysis: From raw light sheet data to quantitative endpoints, with Johanna Perens

Hosted by Harry Salt (neuroscientist & life sciences content creator) · Guest: Johanna Perens, Co-founder & CTO, Vibraint

Topics: the analysis bottleneck · why brain image analysis is an interdisciplinary challenge · deep learning and classical segmentation · model fine-tuning per experiment · region-wise and voxel-wise analysis · choosing the right endpoint · CNS-Voyager™ as an exploration tool


60 min · Available on Spotify & YouTube


Johanna
Johanna Perens
Co-founder &
CTO at Vibraint
Sema_anatomy

WHY WHOLE-BRAIN IMAGE ANALYSIS IS AN INTERDISCIPLINARY CHALLENGE

Turning a terabyte of light sheet data into reliable, publication-ready quantitative endpoints is not a pure computational problem. It requires expertise across three domains, working together at every step of the pipeline.

Neurobiology: Understanding what the signal means biologically. Which metrics are meaningful for which markers and disease models. What artifacts look like in different brain regions. What "interesting" actually looks like when you are surveying 800+ regions.

Imaging physics: Knowing where the signal comes from and what limits it. How microscope architectures, laser settings, and tissue processing protocols shape the raw data. Why the same staining looks different on different instruments.

Computational science: Building and maintaining the mathematical algorithms for segmentation, registration, and statistical analysis at terabyte scale. Training and fine-tuning deep learning models. Managing sub-volume processing without introducing stitching artifacts.
At Vibraint, these three disciplines have worked together through thousands of whole-brain datasets. Every step in our pipeline reflects that combined experience, from the choice of segmentation model to the quality control checks that catch problems a pure-computation approach would miss.

"It is an interdisciplinary field. You need knowledge from neurobiology, imaging physics, and computational science. Having a team who has worked together closely and understands how every step affects the outcome - this is really important. This is why it is so important to offer image analysis as a standalone service."

-Johanna Perens, Vibraint

HOW VIBRAINT'S SEGMENTATION PIPELINE WORKS

Hybrid classical + deep learning approach
Vibraint does not apply a single off-the-shelf AI model to every dataset. Our segmentation pipeline combines classical image processing algorithms with deep learning models, using each where it performs best.

Classical algorithms generate initial segmentations, which are manually curated by our scientists to build high-quality training data. Deep learning models are then trained or fine-tuned on this curated data, learning not just the signal itself but the context: where in the brain certain patterns occur, how signal appearance varies between regions, and what artifacts look like on different instruments.

Fine-tuned per experiment, every time
No two light sheet datasets are identical. Even the same microscope produces different output over time as lasers degrade, firmware is updated, or hardware is replaced. Between laboratories, the variability is far greater: different microscope architectures, tissue processing protocols, antibody batches, and imaging settings all affect the raw signal.

There are no foundational AI models for light sheet data. For every new experiment, we evaluate how similar the data is to what we have seen before and determine whether fine-tuning is needed. Across hundreds of datasets, we have systematically mapped the range of signal variants that occur in practice, using this accumulated experience to train models that are robust to real-world variability.

Quality control at every step
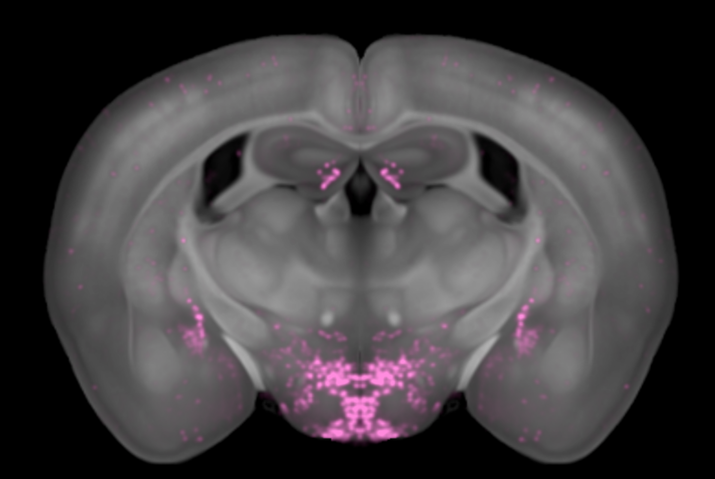
Every processing and analysis step in the pipeline includes quality control, from initial data curation through segmentation to final quantification. We do not run high-throughput pipelines without checking what comes out. If a segmentation model misses cells or a registration step introduces artifacts, we catch it before it reaches your results.

2D-1
3D-1

"I do not believe in high-throughput pipelines that do not do any QC. If you do not check what comes out, you do not actually know if you found all the cells."

-Johanna Perens, Vibraint

Retro_orange

STANDARD QUANTITATIVE ENDPOINTS

Vibraint extracts a comprehensive set of quantitative metrics from every analysed dataset. All endpoints are computed per anatomical brain region (region-wise analysis) and can also be mapped at the individual voxel level (voxel-wise analysis) for spatial statistics.

  • Cell counts and densities: Total detected cells and cell density per region for all labelled populations.

  • Signal coverage: The proportion of each brain region occupied by positive signal - particularly valuable for cytoplasmic markers and biodistribution studies.

  • Signal intensities: Accumulated, mean, or median fluorescence intensity per region.

  • Object-level features: For every individually detected cell: intensity, size, sphericity, and spatial coordinates. Accessible per object in CNS-Voyager™.

  • Distance metrics: Spatial relationships between detected objects and anatomical structures (e.g., proximity of cells to blood vessels).

  • Voxel-wise statistical maps: Group average maps, spatial p-value maps, and differential maps comparing treatment versus control across the full brain volume.

Custom metrics can be developed for specific biological questions. Contact us to discuss your experiment's requirements.


"Every time you get a new experiment, you need to evaluate how similar it is to data before. There are no foundational AI models for light sheet data. You need to fine-tune the model, and you need to quality-check, every single time."

-Johanna Perens, Vibraint

20260601_Iba1_banner_image

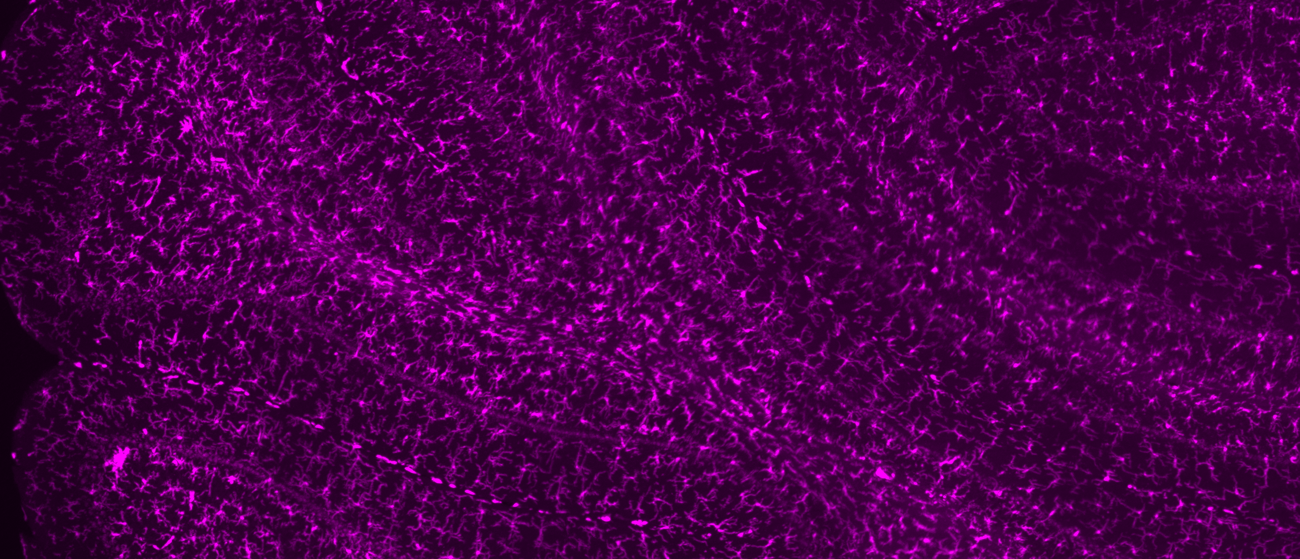
CHOOSING THE RIGHT ENDPOINT: THE MICROGLIA EXAMPLE

Not every metric that seems intuitive is the right one. Consider microglia quantification in neuroinflammation studies. The natural instinct is to count individual microglia. But in inflamed brain regions, microglia migrate together, clump, and change morphology, making individual cell segmentation extremely difficult and unreliable.

When we tested this rigorously, counting every cell with maximum effort, we found that raw counts often do not change between study groups. What does change is local density, captured by voxel-wise analysis and signal coverage metrics.

This is exactly the kind of insight that comes from having analysed the same markers across many studies and understanding the biology behind the signal. The right metric depends on the biology, not just the computation.

"With microglia, it is very intuitive to say: let us count them. But where you have inflammation, they clump together and change shape. We put in the effort to count every single cell and then understood that the count does not actually change. Local densities change. The obvious metric was the wrong one."

-Johanna Perens, Vibraint

Blaze-1-2

REGISTRATION ROBUSTNESS ACROSS PROTOCOLS AND MODELS

The Perens CCF was built from adult male C57BL/6 mice processed with iDISCO+. Registration is most reliable when samples closely match this reference, and for standard iDISCO experiments, accuracy is high and well validated.

For samples that differ, whether by sex, age, mouse strain, or tissue processing protocol, Vibraint applies automated registration quality control to every brain and flags areas where mapping quality requires attention. For protocols that produce substantially different tissue appearance (such as in situ hybridisation or alternative clearing methods), we generate protocol-specific brain templates that are linked to the Allen Brain Atlas via validated transformation chains. This ensures anatomical accuracy regardless of how the tissue was prepared.

We recommend discussing your specific mouse model, strain, and processing protocol during study design, so we can confirm the optimal registration approach before imaging begins.

Tips and Tricks for quantitative whole brain imaging

  • Tissue quality and brain morphology are paramount. Whenever you are planning to register brains to an atlas the tissue needs to be of very high quality. Tears and cuts will affect both the registration and the signal intensity. 

  • Find the optimal resolution. Before starting a big study it is worth spending time finding the optimal scan settings. Scanning at too high resolution will complicate all downstream workflows. Even simple tasks such as moving data between computers or servers can end up being very time consuming.

  • Avoid duplicating data. Many modern light-sheet microscopes use tile scanning. The resulting tiles will therefore need stitching after the scan is finished. Automated workflows tend to store all the intermediate file formats leading to duplications of already large datasets. This is true for many processing steps, and the same data might therefore be duplicated numerous times. Therefore, it is worthwhile spending some time optimizing the workflows and deleting some of the intermediate datasets.  At Vibraint we consider the dataset on which we run the signal segmentation  as the “raw data”. This typically means stitched, down-sampled (to the appropriate resolution) and in some cases post-processed. Anything in between is automatically deleted.    

  • Be nice to your IT department. Having a good IT infrastructure should not be underestimated when dealing with LSFM data. Loop in the experts before flooding their servers with data and explain the process to them. Often they can help set up rules for deleting duplicated/redundant data or moving data between workstations. 

FREQUENTLY ASKED QUESTIONS

SAMPLE SIZE AND CONSULTING

How many animals per group do I need?

We recommend a minimum of eight animals per group for robust statistical analysis. Studies with six animals per group are possible but come with reduced statistical power, which we note transparently in the results. The optimal sample size depends on your expected effect size and biological question. We are happy to discuss this during study design consultation.

Can Vibraint help if we want to analyse our own data in-house?

Yes. We offer consultation sessions for researchers who want to analyse their own data using open-source tools such as BrainGlobe. We can advise on pipeline setup, parameter selection, quality control strategies, and endpoint design, drawing on our experience processing hundreds of whole-brain datasets.

DATA FORMATS AND TRANSFER

Vibraint accepts light sheet datasets in TIFF and HDF5 (.h5) formats, the standard outputs of most light sheet microscopes. If you are unsure whether your data format is compatible, we are happy to check at the consultation stage.

Data is shared via a secure cloud bucket created for each customer, with upload guidelines provided. For large datasets, we advise on the most efficient transfer approach to avoid unnecessary duplication or bandwidth overhead.

TALK TO US BEFORE YOU SCAN

The imaging settings you choose, resolution, step size in Z, number of channels, determine what analysis is possible downstream. A setting that seems reasonable at the microscope can make certain endpoints impossible to extract later.

Our scientists consult before your study begins, so resolution, markers, and imaging parameters are optimized for the quantitative endpoints you need. This is a free consultation, available whether or not you use LS-Journey for the imaging itself.

VIBRAINT'S LS-JOURNEY™ PLATFORM

Tissue_processing
Microscopy
Analysis

We are here to help you get started

At Vibraint, we are passionate about whole brain imaging and light sheet microscopy. It's at the heart of everything we do. Our LS-Journey™ platform provides quantitative whole brain imaging as a service, offering end-to-end solutions from tissue labelling and clearing to light-sheet microscopy and AI-guided image analysis for segmentation and atlas registration. Each step can also be accessed individually to suit your research needs. 

Whether you want to conduct your study with us or need expert advice to begin independently, we are here to help you unlock the amazing potential of whole brain imaging.

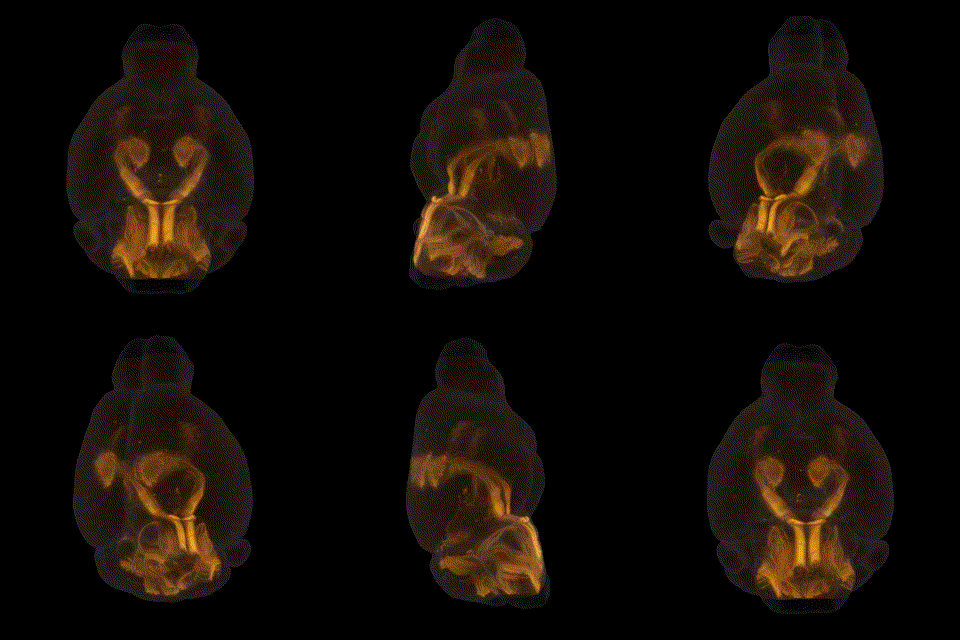
3D brain model

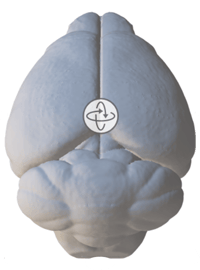
Download a 3D model of Vibraint's virtual brain that can be used to create engaging animations in your presentations.

READY TO DESIGN YOUR WHOLE BRAIN STUDY WITH LS-JOURNEY™

Tell us your target markers, mouse model, sample numbers, and reporting needs and our scientists will design the optimal module combination and provide a detailed quote.