logo_text_black_bg

USING WHOLE BRAIN C-FOS TO ACCELERATE YOUR PRECLINICAL NEUROSCIENCE PROJECTS

Quantitative whole-brain c-Fos activity mapping for CNS drug discovery.

iDISCO clearing · light sheet fluorescence microscopy · AI-assisted image analysis · CCF brain atlas registration · CNS-Voyager™ integration

sema_web
klb_web
april_web
section_5
TAKE THE TEST

FIND OUT IF WHOLE BRAIN IMAGING CAN ACCELERATE YOUR RESEARCH.

From tissue clearing and light sheet microscopy to spatial transcriptomics, single-cell sequencing and traditional immunohistochemistry, neuroscientists today have more tools than ever to study the brain. The challenge is no longer access to technology. It's knowing which approach will actually answer your research question. Each method has trade-offs in resolution, throughput, coverage and cost, and choosing the wrong one can mean months of work that misses the biology that matters most. Whole-brain imaging is transforming how researchers map activity, track drug distribution and uncover circuitry, but it's not the right fit for every question. Take the test to find out whether whole-brain imaging can accelerate your research.


WHAT IS C-FOS?

The c-Fos gene is an immediate early gene (IEG) that is upregulated in neurons that have been activated by a stimulus. This could be after treatment with a drug. Using antibodies or ISH for c-Fos, it is possible to identify recently activated neurons.


HOW IS C-FOS USED IN PRECLINICAL RESEARCH?

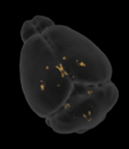
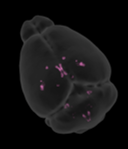
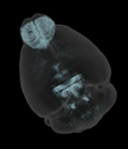
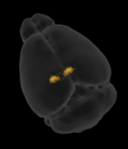
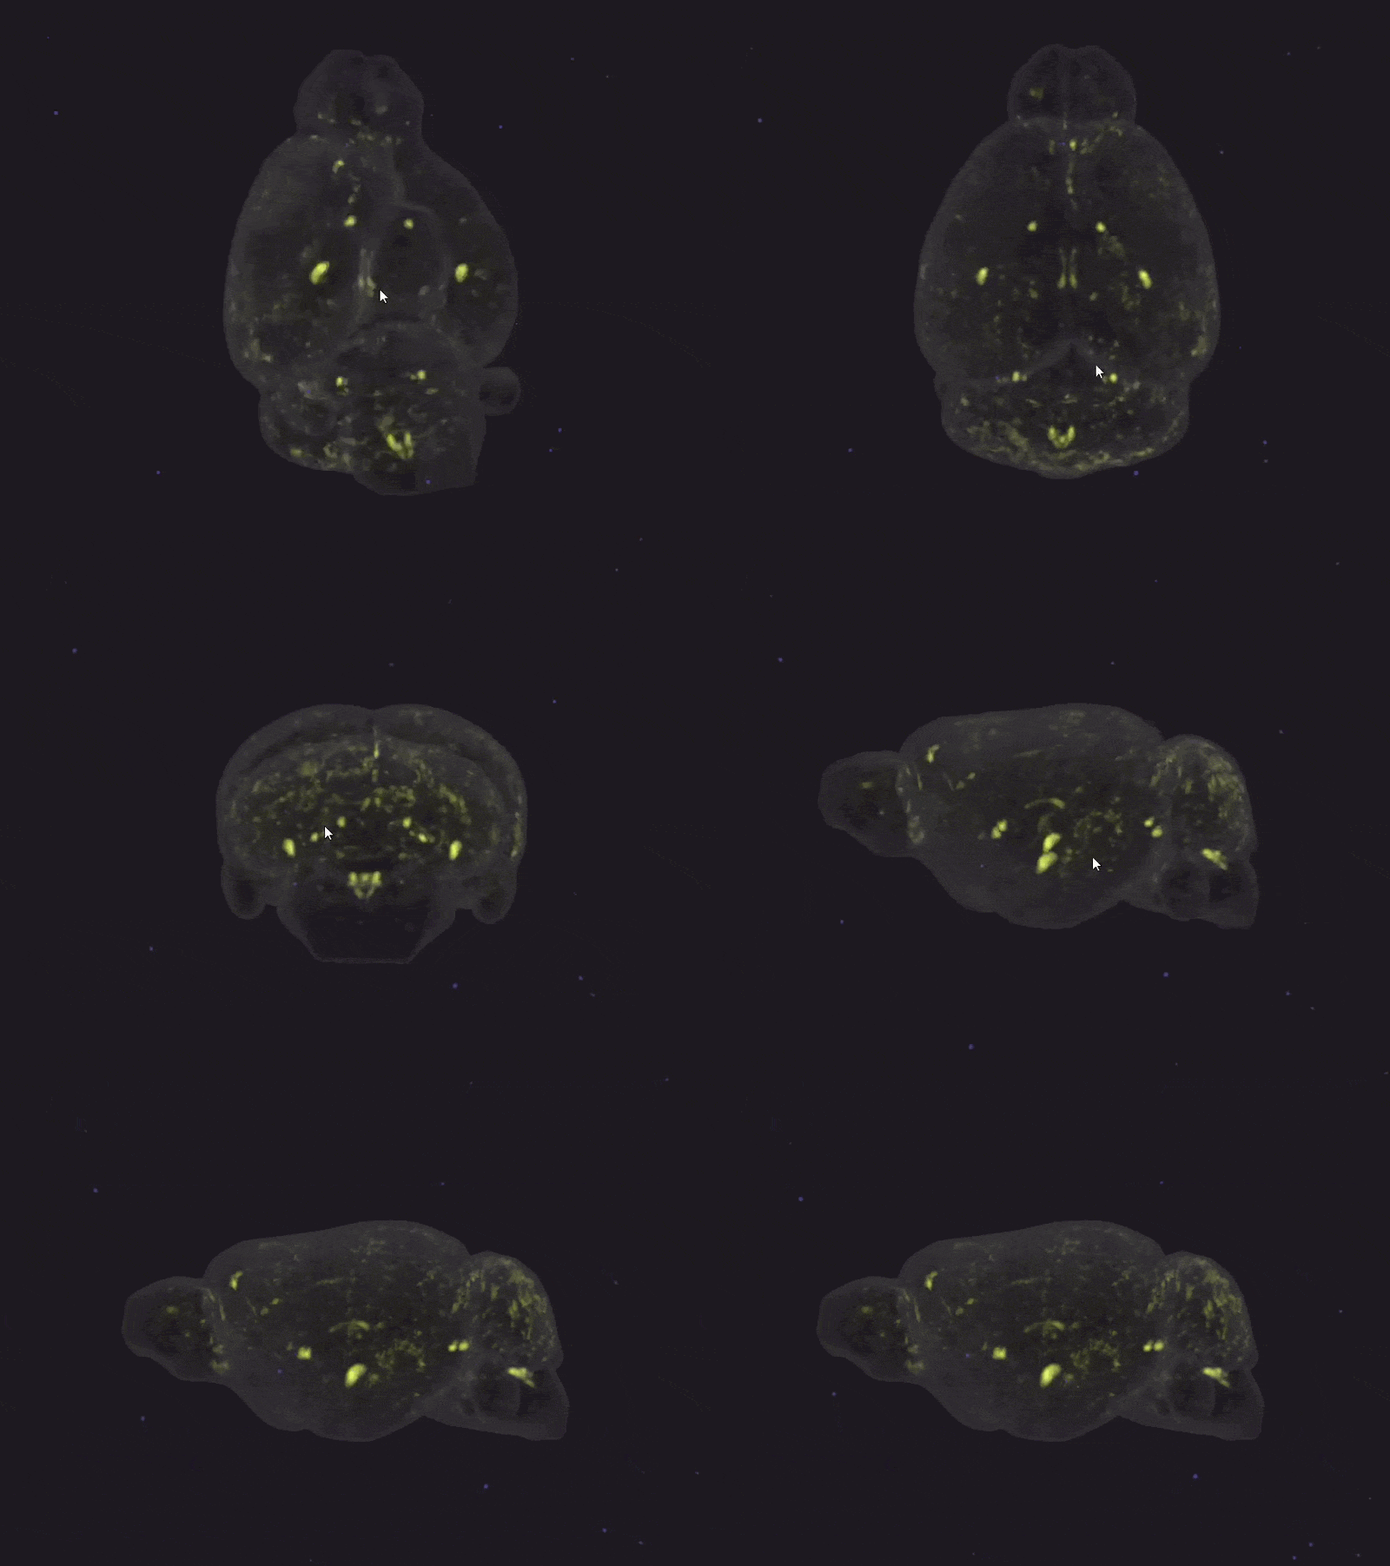
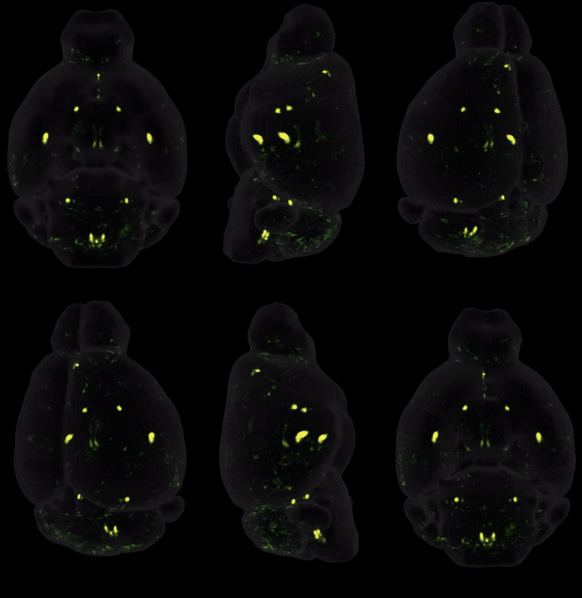
When a drug is administered, it triggers a cascade of events leading to activation of c-Fos expression in certain neurons in the brain. The result is a c-Fos signature of that specific drug that can be visualised with whole brain imaging.


WHY WHOLE BRAIN C-FOS MATTERS FOR DRUG DISCOVERY

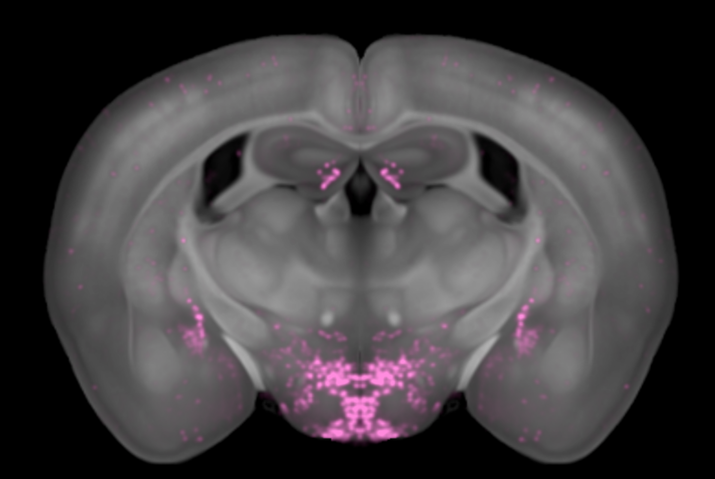
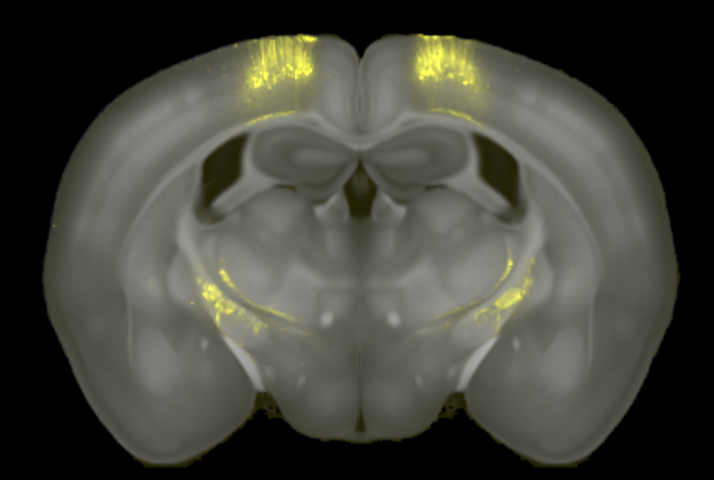
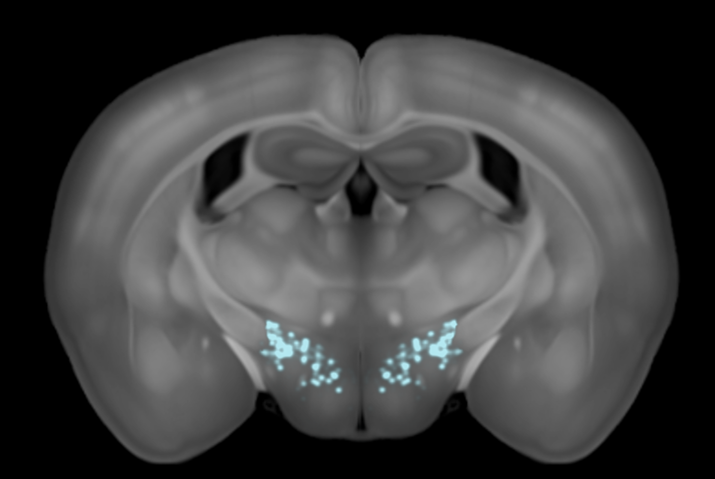
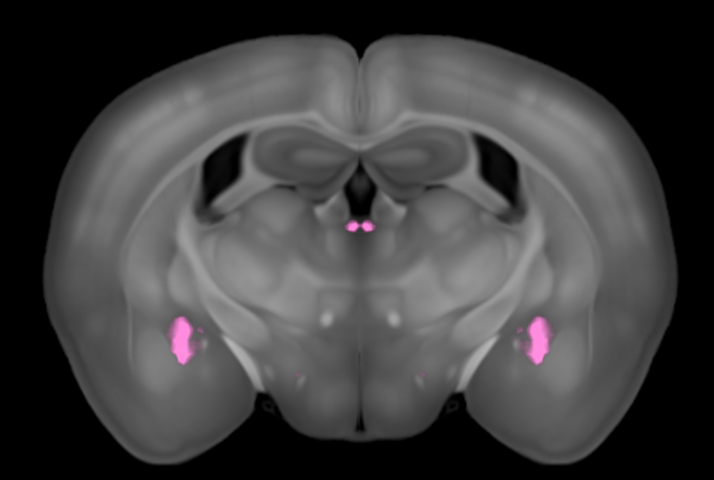
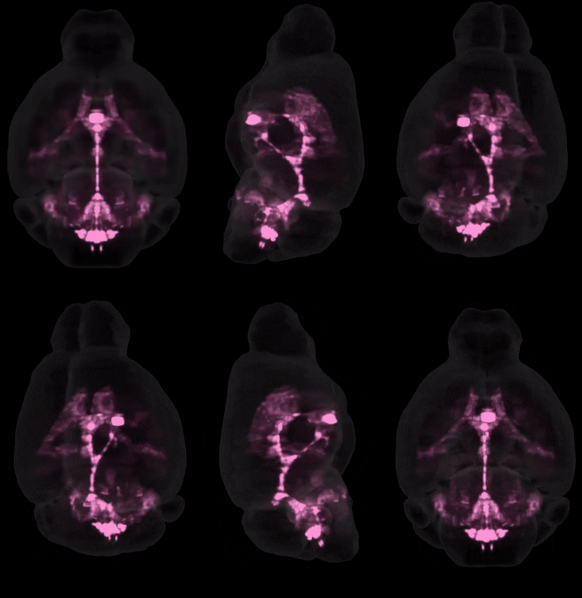
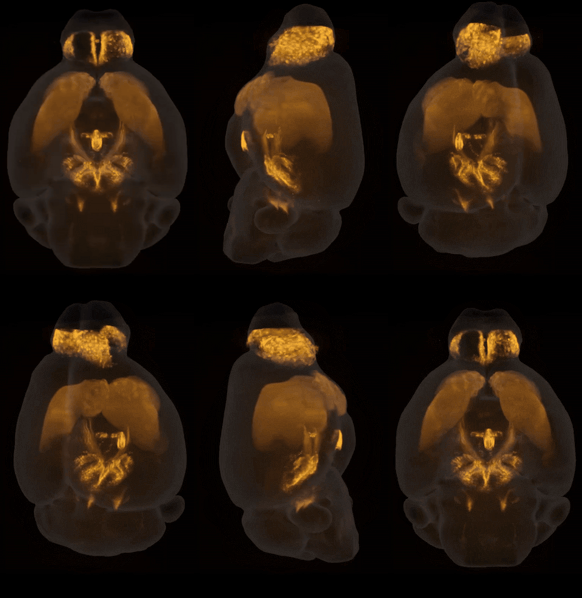
Thomas Topilko joined the Map of the Month podcast to discuss the brain-wide c-Fos signature of semaglutide, how it reveals direct MOA circuits, downstream network effects, and potential side-effect signatures. A practical demonstration of what LS-Journey™ delivers for a real CNS drug programme.

MAP OF THE MONTH - MAY 2026

The brain-wide signature of Ozempic and the science behind c-Fos mapping

Hosted by Harry Salt (neuroscientist & life sciences content creator) · Guest: Thomas Topilko, Co-founder & Lead Scientist, Vibraint · Topics: c-Fos origin story · iDISCO+ tissue clearing · semaglutide brain map · CCF atlas registration · CNS-Voyager™


40 min · Available on Spotify & YouTube


Thomas
Thomas Topilko
Co-founder &
CSO at Vibraint

"What this map shows is not only the direct effect of the drug, this can teach you a lot about the mode of action of a compound, which is something absolutely key for anyone making a drug."

-Thomas Topilko, Vibraint

"It can tell you more about potential side effects of the compound, downstream circuitry areas connected to the primary cells recruited by the drug that are probably fundamental downstream effects."

-Thomas Topilko, Vibraint

"c-Fos can reveal the regions you expect, but more importantly, it finds the ones you did not expect. Especially if you're fishing for subtle effects or rare events, these techniques are extremely powerful."

-Thomas Topilko, Vibraint

THE CHALLENGE

THE BRAIN IS ALREADY COMPLICATED
SO WHY COMPLICATE THINGS FURTHER? 

Traditional histology forces you to pre-select a handful of brain regions and hope you chose the right ones. In CNS drug discovery, that gamble costs months and sometimes entire programmes.

section_5

CONVENTIONAL HISTOLOGY READS 0.1% OF THE BRAIN

A 10 µm coronal section represents roughly 0.1% of the tissue block, like understanding a novel from a single sentence. You make key decisions from a fragment, biased toward regions you already suspect matter.


section_3

LIGHT SHEET DATA IS ENORMOUS AND HARD TO ANALYSE

 A single whole mouse brain generates up to 1 terabyte of imaging data. Without a dedicated pipeline, teams spend months extracting numbers from images that should take days.
section_6

THE TECHNOLOGY DEMANDS A SPECIALIST TEAM

Tissue clearing, light sheet imaging, and 3D image analysis each require dedicated experts. Assembling and maintaining that team in-house  is slow and expensive, and it distracts from core science.
section_2

EVERY MONTH OF DELAY IS LOST REVENUE AFTER LAUNCH

For a preclinical CNS asset, each month lost to slow preclinical workflows can represent tens of millions in delayed revenue after launch. Unbiased whole-brain data earlier in the funnel de-risks decisions before they become expensive.
LS-JOURNEY™ SERVICE

FROM TISSUE TO BRAIN-WIDE INSIGHT

A fully managed end-to-end pipeline. Ship us your fixed brain tissue. We handle everything from staining to data delivery. No equipment. No in-house expertise required.

screenshot-1 (8)
1. C-FOS IMMUNOLABELING

Whole-brain c-Fos staining with validated antibodies. Consistent lot and protocol across all animals, critical for detecting genuine biological signal rather than staining artefacts.

screenshot-3 (4)
2. TISSUE CLEARING - THE BRAIN MADE TRANSPARENT

iDISCO clears the brain by removing lipids and applying refractive-index matching, rendering the intact organ optically transparent while preserving fluorescent signal.

OPTICAL CLEARING

screenshot-2 (4)
3. LIGHT SHEET FLUORESCENCE MICROSCOPY

A thin sheet of laser light scans the cleared brain volumetrically at 2–3 µm isotropic resolution, generating thousands of serial images reconstructed into a complete 3D whole-brain dataset.

screenshot-4 (2)
4. AI-ASSISTED CELL SEGMENTATION AND COUNTING

Deep learning models detect and count every c-Fos-positive nucleus across the full 3D volume, unbiased, single-cell resolution quantification with no manual counting or sampling bias.

screenshot-5 (2)
5. BRAIN ATLAS REGISTRATION TO PERENS CCF

Tissue autofluorescence serves as an anatomical fingerprint to register each brain to the Perens Common Coordinate Framework (Neuroinformatics, 2021), placing every detected cell into a shared anatomical space for cross-animal comparison.

CCF REGISTRATION

screenshot-0 (17)
6. INTERACTIVE DATA DELIVERY IN CNS-VOYAGER™

3D brain maps, per-region cell density statistics, and group-level comparisons delivered on Vibraint's CNS-Voyager™ virtual brain platform, interactive, shareable, and ready for publication-quality export.

WHY VIBRAINT

INTEGRATIVE SPATIAL BIOLOGY BUILT
FOR DRUG DISCOVERY

LS-Journey™ is more than whole-brain imaging. It integrates c-Fos activity maps with complementary biology layers to answer deeper mechanistic questions faster.

brain_1-1

UNBIASED RESULTS AND HYPOTHESIS-FREE DISCOVERY

c-Fos imaging reveals the regions you expected and critically, the ones you did not. Brain-wide coverage eliminates sampling bias and accelerates hypothesis generation from the start of your programme. 


brain_2-1

QUANTITATIVE, STATISTICALLY RELIABLE DATA

Per-region cell counts registered to the Perens CCF allow rigorous group statistics. Compare treatment cohorts, dose-response relationships, and between-study reproducibility with confidence.
brain_3-1

UNDERSTAND MODE OF ACTION AND PREDICT SIDE EFFECTS

A single experiment reveals primary target circuits, downstream network effects, and potential side-effect signatures: Information that once required months of targeted follow-up studies. 


brain_5-1

MULTIMODAL INTEGRATION IN CNS-VOYAGER™

Overlay c-Fos maps with connectivity data, spatial transcriptomics, and functional MRI in one shared coordinate framework, from activity pattern to cell type to circuit, in one platform.
brain_4-1

INDUSTRIAL THROUGHPUT, CRO RELIABILITY

More than 30 years of combined experience in tissue clearing, light sheet imaging, and 3D analysis. Validated protocols, standardised QC, and project management built for biotech and pharma timelines.
brain_6-1

CLOUD-DELIVERED, NO IT BURDEN

Each dataset is up to 1 TB. Vibraint handles storage, processing, and delivery. Your team accesses results through a browser, no specialised hardware or software installation required.

CNS-VOYAGER™ PLATFORM

YOUR DATA. EVERY DIMENSION.
ONE PLATFORM.

CNS-Voyager™ is Vibraint's virtual brain platform, part data delivery system, part neuroscience encyclopaedia. Customer c-Fos maps are delivered here alongside a growing library of public multimodal datasets.

  • Interactive 3D and 2D whole-brain c-Fos map viewer

  • Per-region cell density tables and downloadable statistics

  • Stereotactic coordinate lookup for targeted follow-up

  • Overlay with published connectivity maps and activity atlases

  • Integration with spatial transcriptomics to identify active cell types

  • Shareable links for cross-team and cross-company collaboration

  • Based on peer-reviewed CCF reference brain (Perens et al., Neuroinformatics 2021)

GIF Test
FREQUENTLY ASKED QUESTIONS

EVERYTHING YOU NEED TO KNOW

What is whole brain c-Fos imaging?

Whole brain c-Fos imaging uses the immediate-early gene c-Fos as a proxy for recent neuronal activation. After a stimulus, a drug dose, a behaviour, or a disease state, c-Fos protein accumulates in activated neuronal nuclei within 1-2 hours. Combined with iDISCO tissue clearing and light sheet fluorescence microscopy, every c-Fos-positive cell across the entire mouse brain can be detected, counted, and mapped in 3D, providing a brain-wide snapshot of which circuits were recruited.

How does LS-Journey™ generate quantitative whole brain c-Fos data?

The pipeline begins with validated c-Fos immunolabeling of fixed mouse brain tissue. The tissue is cleared using iDISCO, scanned by light sheet fluorescence microscopy at 2–3 µm isotropic resolution, and all c-Fos-positive nuclei are counted by AI-powered cell segmentation. Each brain is registered to the Perens Common Coordinate Framework (CCF), placing every detected cell into a shared anatomical space. Results are delivered on CNS-Voyager™ with per-region cell density statistics ready for statistical analysis.

What are the limitations of c-Fos as a marker of neuronal activity?

c-Fos is a powerful discovery tool but not a direct recording of neural firing. Key limitations: (1) there is a ~1–2 hour delay between activation and detectable protein signal; (2) not all neurons express c-Fos. Absence of signal does not mean absence of activity; (3) c-Fos reports correlation, not causation. Follow-up experiments using optogenetics, chemogenetics, or electrophysiology are needed to establish causal roles. Used correctly, whole-brain c-Fos mapping is a highly efficient discovery and hypothesis-generation tool.

Can whole brain c-Fos imaging identify drug side effects?

Yes. Because whole-brain maps capture all activated regions simultaneously, they reveal not only the intended target circuits but also downstream network effects that may correspond to side effects. GLP-1 receptor agonists like semaglutide, for example, activate appetite circuits but also engage nausea circuits in the brainstem. Both pathways are visible in a single whole-brain c-Fos map from a single experiment.

What brain regions and species does LS-Journey™ cover?

The LS-Journey™ c-Fos imaging service currently covers the whole mouse brain, including all major regions such as cortex, hippocampus, hypothalamus, amygdala, basal ganglia, brainstem, and cerebellum. Over 800 annotated structures are resolved through registration to the Perens Common Coordinate Framework. Contact Vibraint to discuss custom workflows or additional species.

What does CNS-Voyager™ offer beyond standard delivery?

CNS-Voyager™ is both a data delivery system and a multimodal analysis environment. In addition to your c-Fos maps, it allows overlay with connectivity atlases, neuronal activity reference datasets, and spatial transcriptomics, enabling you to move from "where does my drug act?" to "what cell types respond?" and "which circuits are downstream?" all within a single interactive browser session.

VIBRAINT'S LS-JOURNEY™ PLATFORM

LS-Journey™ is purposely designed to be modular, allowing you to customise your studies as needed. If you do the staining and microscopy, we can analyse the data and upload to CNS-Voyager™.

Tissue_processing
Microscopy
Analysis

READY TO DESIGN YOUR WHOLE BRAIN STUDY WITH LS-JOURNEY™

Tell us your target markers, mouse model, sample numbers, and reporting needs, and our scientists will design the optimal module combination and provide a detailed quote.