logo_text_black_bg

SEE EVERY CIRCUIT YOUR EXPERIMENT ACTIVATES

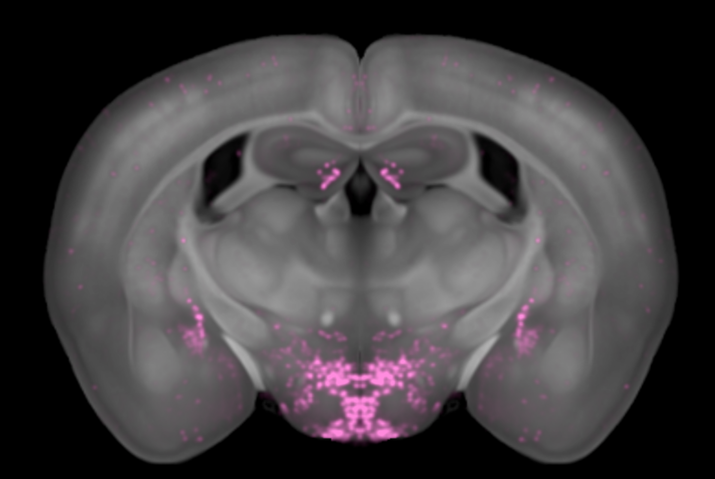
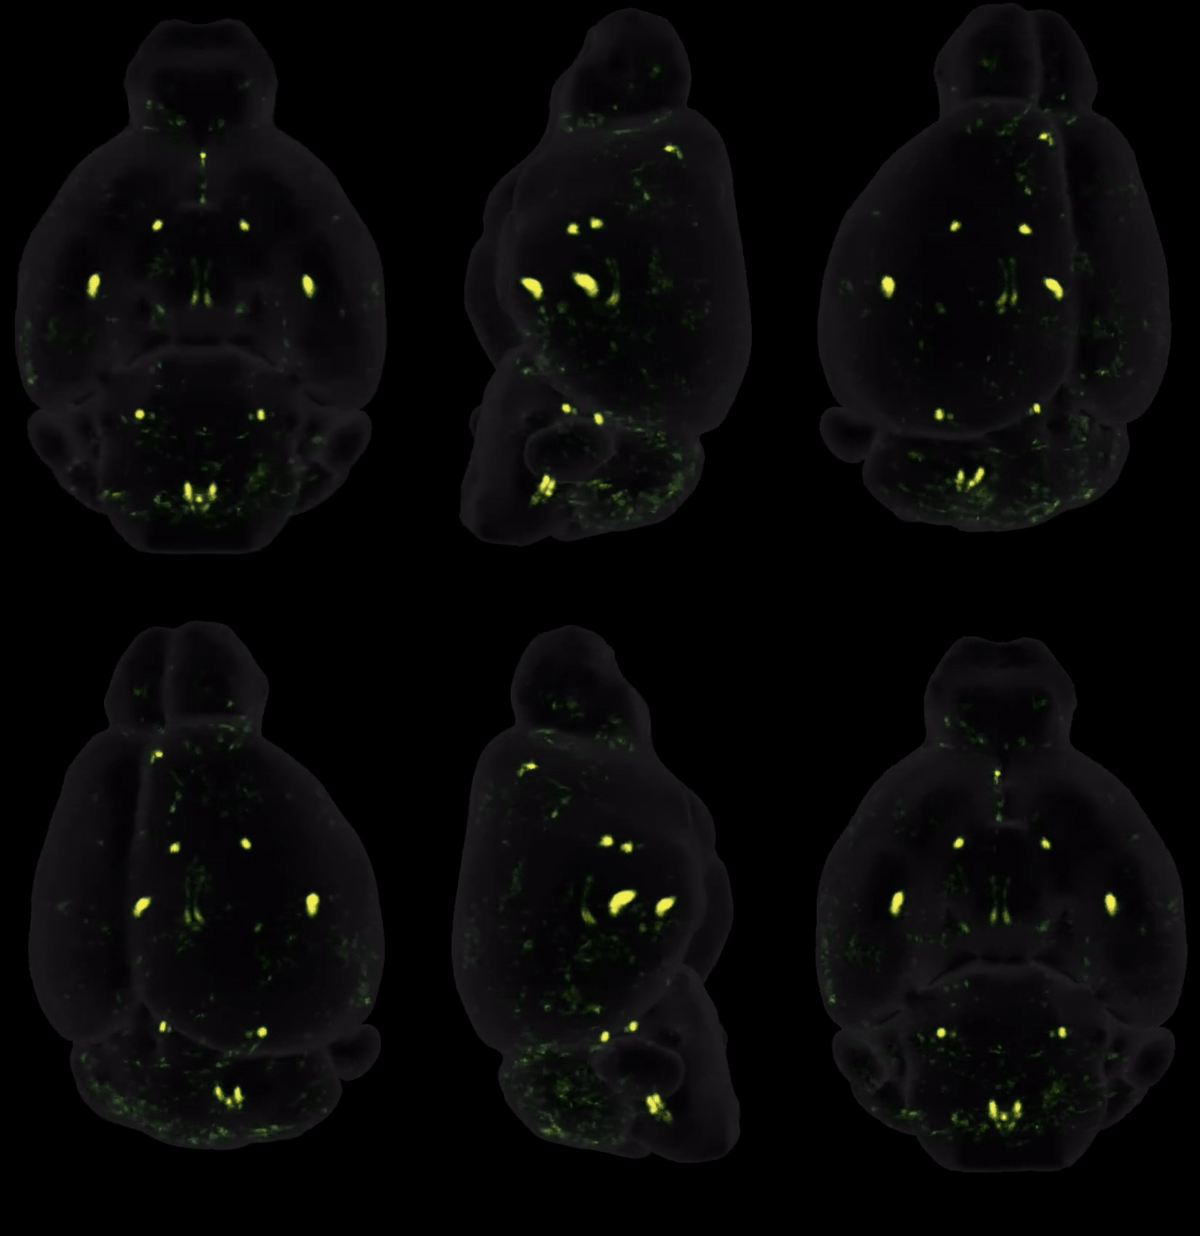
Whole-brain c-Fos imaging with light sheet fluorescence microscopy and AI-assisted CCF atlas registration. Map neuronal activity across all 800+ brain regions simultaneously, unbiased, quantitative, and ready for publication.

iDISCO- clearing · light sheet fluorescence microscopy · AI-assisted image analysis · CCF brain atlas registration · CNS-Voyager™ integration

section_5
TAKE THE TEST

FIND OUT IF WHOLE BRAIN IMAGING CAN ACCELERATE YOUR RESEARCH?

From tissue clearing and light sheet microscopy to spatial transcriptomics, single-cell sequencing and traditional immunohistochemistry, neuroscientists today have more tools than ever to study the brain. The challenge is no longer access to technology. It's knowing which approach will actually answer your research question. Each method has trade-offs in resolution, throughput, coverage and cost, and choosing the wrong one can mean months of work that misses the biology that matters most. Whole-brain imaging is transforming how researchers map activity, track drug distribution and uncover circuitry, but it's not the right fit for every question. Take the test to find out whether whole-brain imaging can accelerate your research.


WHAT IS C-FOS?

The c-Fos gene is an immediate early gene (IEG) that is upregulated in neurons that have been activated by a stimulus. This could be after treatment with a drug. Using antibodies or ISH for c-Fos, it is possible to identify recently activated neurons.

WHY WHOLE BRAIN IMAGING?

Because you don't always know where to look. Traditional sectioning forces region selection before data collection. Whole-brain c-Fos imaging is hypothesis-free and it captures every activated circuit, including regions you didn't anticipate.

WHY LS-JOURNEY™?

A MODULAR APPROACH TO UNBIASED DATA?

  • Complete, unbiased data in one experiment

800+ brain regions quantified simultaneously. No pre-selection, no sampling bias. The data reveals the full picture, including unexpected regions of activity.

  • Statistics your reviewers will accept

Per-region cell counts and voxel-wise statistical maps computed across your experimental groups. The same rigour expected in high-impact journals.

  • Multi-modal integration in CNS-Voyager™

Overlay your c-Fos data with Allen Brain connectivity maps and spatial transcriptomics to identify cell types and circuits in your activated regions, in the same CCF reference space.

  • Validated and reproducible across cohorts

The same iDISCO+ protocol and CCF registration applied to every brain in your cohort and to every cohort Vibraint has processed. Comparable results across experiments and publications. 
sema_web
RESEARCH QUESTIONS

WHAT DOES YOUR EXPERIMENT REVEAL ABOUT THE BRAIN?

Whole-brain c-Fos imaging has been used to map circuit activation across virtually every field of systems neuroscience. Here are six of the most common research applications in academic labs.

screenshot-1 (8)

Fear and anxiety circuits

Map the full brain-wide circuit architecture of fear conditioning, extinction, and recall. Identify which regions beyond the amygdala contribute to fear expression and inhibition.

"Which circuits are engaged during fear conditioning compared to extinction training?"


screenshot-3 (4)

Reward and addiction

Quantify how repeated drug exposure, reward learning, or withdrawal alters circuit activity brain-wide, revealing adaptive and maladaptive changes beyond the mesolimbic system.

"How does repeated cocaine exposure change reward circuit engagement?"

screenshot-0 (17)

Learning and memory

Identify which brain regions are co-activated during acquisition, consolidation, and recall of associative, spatial, or contextual memories across training conditions.

"Which regions are active during contextual memory consolidation 24 hours after learning?"

screenshot-4 (2)

Social behaviour

Map brain-wide activity differences between social and non-social experimental conditions including sex differences, developmental changes, and effects of social isolation.

"Which circuits differentiate social from non-social interaction in male vs. female mice?"

screenshot-5 (2)

Sleep, circadian, and homeostasis

Quantify activation of hypothalamic and brainstem circuits during sleep deprivation, feeding, energy balance, and circadian disruption, without the limits of targeted sampling.

"Which hypothalamic circuits activate during acute sleep deprivation?"

screenshot-2 (4)

Disease model comparisons

Compare brain-wide circuit activation between wild-type and disease model animals. Identify regions of hypo- or hyper-activity that characterise the pathological state.

"How does circuit activation in response to a stressor differ in a depression model vs. controls?"

EXPERT PERSPECTIVE

IN CONVERSATION: C-FOS, WHOLE BRAIN DISCOVERY, AND THE SCIENCE BEHIND THE MAPS

Thomas Topilko joined the Map of the Month podcast to discuss the whole-brain c-Fos signature of semaglutide, why the technique's greatest strength is finding what you didn't expect, and how LS-Journey™ turns beautiful images into quantifiable science.

MAP OF THE MONTH - MAY 2026

The brain-wide signature of Ozempic and the science behind c-Fos mapping

Hosted by Harry Salt (neuroscientist & life sciences content creator) · Guest: Thomas Topilko, Co-founder & Lead Scientist, Vibraint · Topics: c-Fos origin story · iDISCO+ tissue clearing · semaglutide brain map · CCF atlas registration · CNS-Voyager™


40 min · Available on Spotify & YouTube


Thomas
Thomas Topilko
Co-founder &
CSO at Vibraint

"c-Fos is best seen as a brain-wide molecular snapshot, extremely powerful for finding candidate circuits, but something that needs clear follow-up with causal tools like optogenetics, chemogenetics, and electrophysiology."

-Thomas Topilko, Vibraint

"Its biggest strength is discovery. c-Fos can reveal the regions you expected, but more importantly, it can find the ones you did not expect. And in a structure as heterogeneous as the brain, that matters enormously."

-Thomas Topilko, Vibraint

"A 10 µm coronal section represents roughly 0.1% of the tissue block, like trying to understand a novel by reading a single sentence. Whole-brain imaging lets you read the whole book."

-Thomas Topilko, Vibraint

HOW IT WORKS

FROM BEHAVIOUR TO BRAIN-WIDE ACTIVITY MAP

LS-Journey™ is modular and you can enter at any step. Most academic labs send us perfused, fixed brains after the  behavioural experiment; we handle everything from there.


TISSUE PREP
iDISCO+ clearing & c-Fos staining

Perfused, fixed mouse brains processed with Vibraint's validated iDISCO+ protocol. Whole-brain c-Fos IHC using consistently lot-controlled primary and secondary antibodies, critical for detecting genuine biological signal across your cohort.

Ship us your fixed brains. Vibraint provides detailed perfusion and shipping protocols.

IMAGING
Light sheet fluorescence microscopy

A 5 µm isotropic resolution per brain is sufficient for reliable c-Fos nucleus detection throughout the full depth. Dual channel acquisition captures c-Fos signal and tissue autofluorescence for simultaneous CCF registration.

You can also image externally cleared samples from your lab.

AI ANALYSIS
Cell detection & CCF atlas registration

Deep learning detects and counts every c-Fos-positive nucleus across the full 3D brain volume. The dataset is registered to the Perens CCF, placing every detected cell into its correct anatomical region across all 800+ areas, automatically.


We can also analyse LSFM data of externally scanned brains.

DATA DELIVERY
Interactive delivery on CNS-Voyager™

Quantitative results delivered via CNS-Voyager™. Explore 3D and 2D brain maps, compare groups, overlay Allen Brain Atlas data, and export publication-quality figures directly from your browser, no software installation required.

FROM DATA TO PUBLICATION

OUTPUTS BUILT FOR PEER-REVIEWED NEUROSCIENCE JOURNALS

Every LS-Journey™ c-Fos study is designed with publication in mind. The outputs are structured to meet the methodological standards expected by high-impact neuroscience journals.


Quantitative data for statistical analysis

Per-region c-Fos cell counts for all 800+ CCF areas, delivered in exportable formats compatible with R, Python, GraphPad Prism, and SPSS. Ready for standard statistical tests (t-test, ANOVA, mixed models) and multiple comparisons correction.

  • Cell counts per region, all 800+ CCF areas

  • Cell density normalised to region volume

  • Group average maps and standard deviation

  • Voxel-wise statistical maps (t-maps, z-maps)

  • Export-ready data tables (CSV, Excel)

Figures and multi-modal integration

High-resolution brain figures, activity heatmaps, and group comparison maps exportable directly from CNS-Voyager™ in print-ready resolution. Overlay your c-Fos data with Allen Brain connectivity and spatial transcriptomics to contextualise activated circuits at the cell-type level.

  • High-resolution whole-brain figures for journals

  • Coronal and sagittal 2D section views

  • Overlay with Allen Brain connectivity maps

  • Overlay with spatial transcriptomics data

  • Shareable links for collaborators

Methods text included. Vibraint provides a standardised methods description for the LS-Journey™ pipeline. Ready to include in your manuscript methods section, covering tissue processing, imaging parameters, and CCF registration. Citable with peer-reviewed publications.

PUBLISHED RESEARCH

SELECTED PAPERS USING QUANTITATIVE
WHOLE BRAIN C-FOS

These publications used the LS-Journey™ approach to answer systems neuroscience questions, demonstrating the range and impact of brain-wide c-Fos mapping in peer-reviewed research.

2024 · Atlas of Exercise-Induced Brain Activation in Mice

Skovbjerg et al. · Molecular Metabolism (link) · Featured on the front cover

2024 · TAAR1 Agonists Improve Glycemic Control, Reduce Body Weight and Modulate Neurocircuits Governing Energy Balance and Feeding

Dedic et al. · Molecular Metabolism (link)

2023 · GLP-1 and Nicotine Combination Therapy Engages Hypothalamic and Mesolimbic Pathways to Reverse Obesity

Falk et al. · Cell Reports (link)

2021 · Whole-Brain Mapping of Amylin-Induced Neuronal Activity in Receptor Activity-Modifying Protein 1/3 Knockout Mice

Skovbjerg et al. · European Journal of Neuroscience (link)


FREQUENTLY ASKED QUESTIONS

WHAT ACADEMIC NEUROSCIENTISTS ASK
ABOUT WHOLE BRAIN C-FOS

What is c-Fos used for in neuroscience research?

c-Fos is an immediate early gene (IEG) transiently expressed in neurons within 30–60 minutes of activation. Detecting c-Fos protein by IHC identifies recently active neurons. In whole-brain studies, c-Fos maps which circuits engage during a specific behaviour, stimulus, or experimental condition, providing a snapshot of brain-wide neural activity at a defined time point.

What are the limitations of c-Fos as a neuronal activity marker?

c-Fos reflects a time-limited window of activity and the peak protein expression is typically 60–90 minutes after a stimulus. Inhibitory neurons tend to express lower c-Fos levels than excitatory neurons, potentially underrepresenting inhibitory contributions. c-Fos does not distinguish excitatory from inhibitory signalling. Some active neurons may not express detectable levels. For these reasons, whole-brain c-Fos data is most powerful when interpreted alongside complementary approaches such as electrophysiology, calcium imaging, or optogenetics.

Can I combine whole brain c-Fos with other markers?

Yes. LS-Journey supports multiplexed whole-brain IHC and c-Fos can be combined with cell-type specific markers (NeuN, TH, parvalbumin, ChAT) or signalling markers (pERK, pCREB) in the same brain. Dual-channel light sheet imaging captures both signals simultaneously, enabling co-localisation analysis, for example you can identify what proportion of c-Fos-positive neurons in each region are dopaminergic or GABAergic. Note: the possibility of combinations depends on the species of antibodies used.

Can I overlay my c-Fos data with Allen Brain Atlas connectivity data?

Yes. CNS-Voyager allows direct overlay of your c-Fos activity maps with Allen Brain Atlas connectivity data, spatial transcriptomics maps, and published neuronal activity datasets, all are co-registered to the same CCF. This enables researchers to contextualise activated regions by their connectivity and cell-type gene expression profiles within the same 3D reference space.

How is whole brain c-Fos different from traditional IHC sections or in situ hybridisation?

Traditional c-Fos IHC or ISH requires sectioning and selecting specific regions before data collection, introducing sampling bias. Whole-brain light sheet c-Fos imaging captures every c-Fos-positive neuron across all 800+ regions in a single 3D dataset, with AI-automated counting. The approach is hypothesis-free: it reveals activity in regions the researcher did not anticipate, which is often where the most interesting findings emerge.

How many animals per group are needed for whole brain c-Fos studies?

Vibraint recommends a minimum of 6–8 animals per group for robust statistical analysis, though the optimal number depends on expected effect size and experimental variability. Voxel-wise statistical comparisons benefit from larger group sizes. Vibraint's team can advise on study design and power analysis based on your specific experimental question and model. Contact us to discuss your study design before submission.

What statistical outputs does LS-Journey™ produce for c-Fos publications?

LS-Journey™ delivers per-region quantitative c-Fos cell counts for all 800+ CCF areas and it is compatible with standard statistical tests in R, Python, Prism, and SPSS. Vibraint also provides voxel-wise statistical maps comparing group averages, suitable for visualising and reporting brain-wide activity differences. All data is delivered in exportable formats.

How do I send samples and what is the typical turnaround time?

Samples should be shipped as perfused-and-fixed brains in PBS containing 0.1% PFA at 4°C. Vibraint provides a detailed perfusion fixation protocol and shipping guidelines. Typical turnaround from sample receipt to data delivery in CNS-Voyager™ is 8–10 weeks, depending on cohort size and study complexity. Contact Vibraint (contact@vibraint.dk) to discuss timelines for your specific project.

VIBRAINT'S LS-JOURNEY™ PLATFORM

LS-Journey™ is purposely designed to be modular. This way you can customise your studies as you wish. If you do the staining and microscopy, we can analyse the data and upload to CNS-Voyager™.

Tissue_processing
Microscopy
Analysis

READY TO DESIGN YOUR WHOLE BRAIN STUDY WITH LS-JOURNEY™

Tell us your target markers, mouse model, sample numbers, and reporting needs and our scientists will design the optimal module combination and provide a detailed quote.