logo_text_black_bg

MAP WHERE YOUR DRUG GOES IN THE BRAIN, AT CELLULAR RESOLUTION

Brain-wide drug biodistribution and target engagement mapping using fluorescently-labelled compounds and light sheet fluorescence microscopy. Visualise and quantify drug distribution, receptor binding, and BBB penetration across all 800+ anatomical regions simultaneously.

iDISCO+ clearing · light sheet fluorescence microscopy · AI-assisted image analysis · CCF brain atlas registration · CNS-Voyager™ integration


section_5
TAKE THE TEST

FIND OUT IF WHOLE BRAIN IMAGING CAN ACCELERATE YOUR RESEARCH.

From tissue clearing and light sheet microscopy to spatial transcriptomics, single-cell sequencing and traditional immunohistochemistry, neuroscientists today have more tools than ever to study the brain. The challenge is no longer access to technology. It's knowing which approach will actually answer your research question. Each method has trade-offs in resolution, throughput, coverage and cost, and choosing the wrong one can mean months of work that misses the biology that matters most. Whole-brain imaging is transforming how researchers map activity, track drug distribution and uncover circuitry, but it's not the right fit for every question. Take the test to find out whether whole-brain imaging can accelerate your research.


VIBRAINT PRODUCT SERIES · EPISODE 2 

Drug biodistribution and target engagement. How whole brain imaging maps where your drug goes

Hosted by Harry Salt (neuroscientist & life sciences content creator) · Guest: Jacob Hecksher-Sørensen, CEO & Co-founder, Vibraint · Topics: fluorescent drug tracing · peptides vs antibodies vs RNA/DNA · blood-brain barrier & CVOs · brain shuttle validation · target engagement controls · NDA qualification · compound selection and ranking


25 min · Available on Spotify & YouTube


Jacob
Jacob Hecksher-Sørensen
Co-founder &
CEO at Vibraint

"Wherever you target and engage the receptor of the drug will always be in the same place across animals. The statistical maps are really, really useful and give you a very precise understanding of exactly where your drug is working."

Jacob Hecksher-Sørensen, CEO

"If you compare five different compounds and suspect they distribute differently, the statistical maps allow you to very precisely say - are they all the same, or pick the two extremes and compare their efficacy directly."

Jacob Hecksher-Sørensen, CEO

"The GLP-1 data we did for Novo was part of the NDA for Saxenda, the first  GLP-1-based obesity drug approval. This data has actually been used in a regulatory submission."


Jacob Hecksher-Sørensen, CEO

WHAT IS IT?

BRAIN-WIDE DRUG DISTRIBUTION IMAGING EXPLAINED

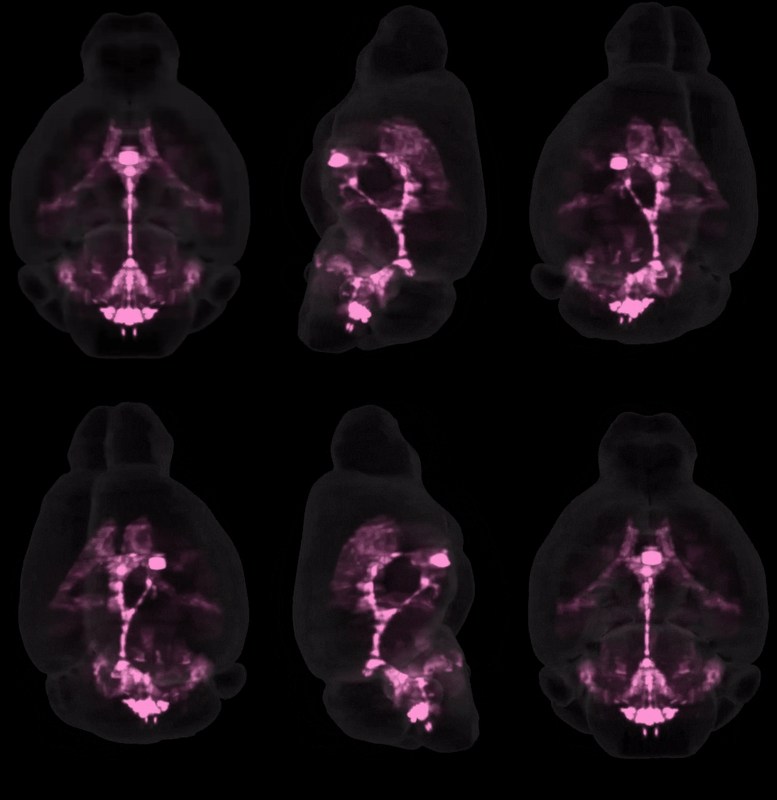
Drug biodistribution imaging answers one of the most fundamental questions in CNS drug development: where does my drug actually go in the brain? A fluorescent tag is attached to the compound of interest, injected into a mouse, and allowed to distribute for a defined period. The brain is then removed, optically cleared, and imaged with light sheet fluorescence microscopy.

The fluorescent signal, representing drug accumulation, is quantified per anatomical region using AI-assisted CCF atlas registration. This generates a spatial map of exactly where the drug distributes, which receptor-expressing neurons it engages, and how its distribution pattern compares across compound classes, formulations, or doses.

klb_web
REGULATORY TRACK RECORD

From GLP-1 brain mapping to Saxenda NDA qualification

Whole-brain drug biodistribution imaging has been used in regulatory submissions. The GLP-1 brain distribution data generated by Vibraint's founders at Novo Nordisk was used to qualify Saxenda for NDA approval, the first peptide-based obesity drug approved by the FDA. This established whole-brain fluorescent drug mapping as a validated approach in the regulatory context.

This precedent demonstrates the evidentiary weight that brain-wide distribution data can carry in IND and NDA applications for CNS drug programmes.

KEY APPLICATIONS

WHAT BRAIN-WIDE BIODISTRIBUTION
IMAGING REVEALS

Four high-value applications. Each capable of influencing go/no-go decisions in a CNS drug programme.


Blood-brain barrier penetration

Map where your drug crosses the BBB and which circumventricular organs (CVOs) it accesses. For brain shuttle programmes, directly compare CNS penetration with and without the shuttle. Brain-wide, at cellular resolution.

Compound selection and ranking

Compare how ten drug candidates distribute in the brain and select the one that reaches the target receptor most efficiently. Vibraint generates statistical distribution maps for all candidates simultaneously, enabling head-to-head comparison.

Target engagement validation

Confirm that your drug binds the intended receptor in the intended brain region using receptor knockout controls, competitive displacement, or downstream phosphorylation markers as orthogonal readouts of target occupancy.

Side-effect circuit identification

Map drug accumulation in circuits associated with nausea, aversion, or other CNS side effects and use this data to kill programmes early or optimise lead compounds away from undesired targets.

Single-cell resolution imaging

Movie of a mouse brain stained with antibodies against CD31 for labelling the vasculature.

DRUG CLASS COMPATIBILITY

COMPATIBLE WITH PEPTIDES, ANTIBODIES AND RNA/DNA MOLECULES

Whole-brain biodistribution imaging is compatible with a range of drug classes. Each with specific considerations for labelling, controls, and study design.


Peptides. Best fit

GLP-1 agonists, neuropeptides & analogues

Peptides are the ideal drug class for biodistribution imaging. They are small enough to label with a fluorophore without greatly altering their biological properties, and receptor specificity can be rigorously confirmed using knockout animal controls or competitive displacement with non-labelled peptide.

Vibraint's foundational experience with GLP-1 mapping, spanning liraglutide, semaglutide, and other GLP-1 analogues, provides a validated framework for peptide biodistribution studies in metabolic disease and obesity programmes.

  • Fluorophore added directly to peptide backbone

  • Receptor knockout controls confirm specificity

  • Competitive pre-treatment with unlabelled peptide as orthogonal control

  • Validated for GLP-1, GIP, glucagon, NPY, PYY analogues and multi-agonists
 

Antibodies & brain shuttles

Therapeutic antibodies, brain-shuttle conjugates & biologics

Antibodies are well suited to biodistribution imaging. Their large size allows fluorophore conjugation without significantly altering binding properties. Human therapeutic antibodies can be detected in mouse brain using species-specific secondary antibodies, eliminating the need for direct labelling.

Brain shuttle validation is a particularly powerful application: direct comparison of shuttle-enabled vs standard antibody brain distribution quantitatively demonstrates enhanced CNS penetration across all anatomical regions.

  • Direct fluorophore conjugation or secondary antibody detection

  • Brain shuttle effect quantified brain-wide in one experiment

  • Amyloid, tau, and aSyn antibody engagement confirmed in disease models

  • Transferrin receptor shuttle studies, with/without shuttle comparisons

RNA/DNA & AAV

siRNA, ASOs, mRNA, and AAV viral vectors

Nucleic acid therapeutics and viral vectors are an emerging application with additional complexity. Unlike peptides, they lack a defined receptor interaction to serve as a biological control thus requiring alternative approaches such as comparing multiple fluorophores with different physicochemical properties to deconvolve fluorophore-driven vs molecule-driven distribution.

For AAV vectors, biodistribution imaging can map brain-wide transduction, which is particularly important given safety considerations around off-target CNS delivery. Target knockdown can also be directly measured by staining for the target RNA or protein, confirming therapeutic effect at the site of delivery.

  • Multiple fluorophore strategy to control for physicochemical artefacts

  • AAV brain transduction mapping brain-wide

  • Target knockdown confirmed by immunostaining at distribution sites

  • Emerging field, study design discussed case-by-case


BLOOD-BRAIN BARRIER

WHERE THE BRAIN LETS YOUR DRUG IN, AND WHERE IT DOES NOT 

The blood-brain barrier (BBB) prevents most large molecules from entering the brain parenchyma. However, there are specific anatomical structures called circumventricular organs (CVOs). In the CVOs the BBB is intentionally permeable, allowing the brain to sense peripheral signals. Whole-brain imaging maps drug access across all of these access points simultaneously.

For CNS disease programmes targeting regions beyond the CVOs,  such as Alzheimer's or Parkinson's pathology spread across the cortex and hippocampus, BBB penetration is the central challenge. Brain shuttles (molecules that bind BBB transporters such as transferrin receptor) are now enabling dramatically improved CNS access, and whole-brain imaging is uniquely able to demonstrate and quantify this effect.

Area postrema

Hindbrain CVO for sensing blood-borne signals. Key for nausea and emesis circuits. Naturally accessed by GLP-1 agonists.


Median eminence

Hypothalamic CVO. The gateway for metabolic hormones entering hypothalamic appetite and energy balance circuits.


Arcuate nucleus

Adjacent to the median eminence. Houses AgRP/NPY and POMC neurons. Primary site of GLP-1 receptor-mediated appetite suppression.

Subfornical organ & OVLT

Additional CVO sites relevant for thirst regulation, cardiovascular control, and CNS immune sensing.

Brain shuttle programmes: A transformative application

Brain shuttles are antibodies or other molecules that bind BBB transporters (transferrin receptor, TFR) and are actively transported into the parenchyma. Whole-brain imaging directly demonstrates and quantifies the shuttle effect by comparing brain-wide drug distribution with and without the shuttle in a single experiment. This provides compelling, spatially-resolved evidence of BBB crossing for regulatory purposes and lead optimisation decisions.

IND/NDA-enabling biodistribution data

Brain-wide drug distribution data has been accepted in regulatory submissions. Saxenda (liraglutide) NDA qualification included whole-brain GLP-1 receptor mapping data generated using this approach. IND/NDA-enabling regulatory reports, formatted for FDA and EMA submissions, are available on request for any LS-Journey™ biodistribution study.

WHAT YOU RECEIVE

COMPLETE DATA DELIVERABLES
FOR BIODISTRIBUTION STUDIES 

Every LS-Journey™ biodistribution study delivers quantitative, spatially-resolved drug distribution data. Ready for decision making, publication, and regulatory submission.

Brain-wide fluorescence intensity maps

3D distribution maps of drug signal quantified across all 800+ CCF regions. Group averages, statistical comparisons, and per-animal data.


Statistical significance maps

Voxel-wise and region-wise statistical maps comparing treated vs control cohorts to identify where the signal is consistently drug-specific vs non-specific background.


Receptor co-registration in CNS-Voyager™

Drug distribution overlaid with receptor expression data to confirm target engagement and flagging unexpected off-target sites within the same CCF reference space.


Per-region intensity tables and statistics

Quantitative fluorescence intensity data for all 800+ regions. Exportable for statistical analysis in R, Python, Prism, or SPSS. Suitable for regulatory data packages.

Compound comparison panels

Side-by-side distribution maps for multiple drug candidates. Enabling direct head-to-head comparison of CNS penetration and target engagement across your compound library.


CNS-Voyager™ interactive 3D viewer

Interactive exploration of distribution data. Navigate the brain in 3D and 2D, look up receptor expression at any site, and export figures for publications and regulatory reports.


Standard study report (on request)

Scientific narrative summary of drug distribution findings, target engagement assessment, and statistical analysis, authored by Vibraint scientists.

IND/NDA-enabling report (on request)

Regulatory-formatted for FDA/EMA submissions. Complete methodology, QC records and structured quantitative distribution data. Saxenda NDA precedent established.

FREQUENTLY ASKED QUESTIONS

WHAT DRUG DISCOVERY TEAMS ASK ABOUT WHOLE
BRAIN BIODISTRIBUTION IMAGING

What is whole brain drug biodistribution imaging?

Whole brain drug biodistribution imaging involves labelling a drug or compound with a fluorescent molecule, injecting it into a mouse, and imaging the intact cleared brain with light sheet fluorescence microscopy. Fluorescent signal is quantified per anatomical region using AI-assisted CCF registration, revealing exactly where the drug distributes, which receptor-expressing neurons it engages, and how distribution compares across compound classes or formulations.

How is fluorescent drug distribution quantified across brain regions?

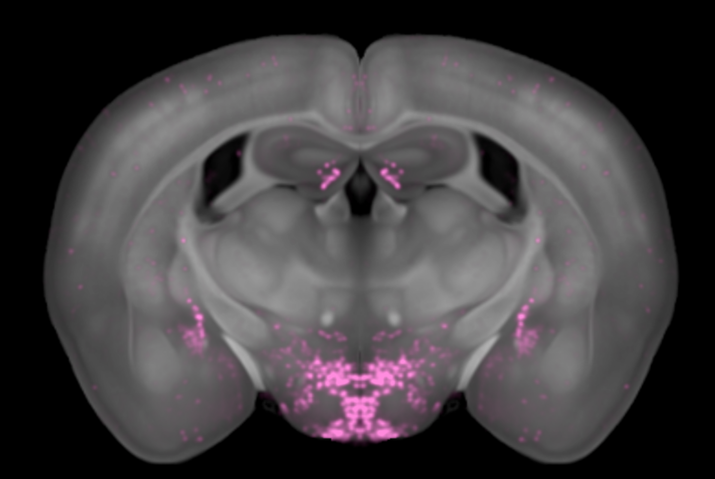
Fluorescent intensity is measured per CCF anatomical region across all 800+ brain areas. Statistical maps are generated by averaging signal across all animals in a treatment group, distinguishing receptor-bound drug (consistent anatomical location across all animals) from non-specific signal such as drug trapped in vasculature (which varies between animals). This statistical approach provides high-confidence, spatially precise maps of where the drug specifically engages its target.

Which drug types are compatible with whole brain biodistribution imaging?

Peptides work best. Small enough to label without major property changes, with receptor knockout and competitive displacement controls. Antibodies are well-suited for direct or indirect labelling; brain shuttle comparisons are a particularly powerful application. RNA/DNA molecules and AAV vectors can be tracked, though controls are more complex. Human therapeutic antibodies can be detected using secondary antibodies without direct labelling.

How does this approach map blood-brain barrier penetration?

Drug signal is mapped across all brain regions simultaneously, including circumventricular organs (area postrema, median eminence, arcuate nucleus) where the BBB is naturally permeable. For brain shuttle programmes, direct comparison of distributions with and without the shuttle demonstrates enhanced parenchymal penetration. Statistical group maps show consistent drug accumulation in BBB-crossing regions versus variable non-specific vascular signal.

Can biodistribution imaging be used for IND or NDA applications?

Yes. Whole brain GLP-1 distribution data generated by Vibraint's founders at Novo Nordisk was used to support the NDA qualification of Saxenda, the first GLP-1-based obesity drug approved by the FDA. IND/NDA-enabling regulatory reports, formatted for FDA and EMA submissions with complete methodology documentation and QC records, are available on request for any LS-Journey biodistribution study.

How does this compare to PET imaging for drug biodistribution?

PET provides in vivo temporal dynamics but has very limited spatial resolution in preclinical rodent models, making precise anatomical localisation difficult. Light sheet biodistribution imaging provides cellular-resolution 3D mapping post-mortem, precisely localising drug signal to specific brain nuclei. Both are complementary: PET confirms real-time dynamics, light sheet provides precise anatomical mapping. Studies using both modalities provide the strongest combined evidence for regulatory and publication purposes.

Can chronic treatment studies track receptor downregulation over time?

Yes. Acute studies map where the drug distributes after a single dose. Chronic studies, treating continuously for days or weeks, can reveal receptor downregulation: as receptors are desensitised and downregulated, the distribution pattern of the fluorescently-labelled drug changes accordingly. This provides valuable insight into the pharmacodynamic consequences of sustained target engagement and can inform dosing schedules in CNS drug programmes.

What controls are needed for a biodistribution study?

For peptides: receptor knockout animals (most rigorous), or competitive pre-treatment with non-labelled peptide. For antibodies: species-matched isotype control, or comparison with/without brain shuttle. For RNA/DNA: multiple fluorophores with different physicochemical properties to separate molecule-driven from fluorophore-driven distribution. A vehicle-only control group is always included to account for tissue autofluorescence differences. Vibraint designs the optimal control strategy for each programme. Contact us to discuss your specific compound.

VIBRAINT'S LS-JOURNEY™ PLATFORM

LS-Journey™ is purposely designed to be modular. This way you can customise your studies as you wish. If you do the staining and microscopy, we can analyse the data and upload to CNS-Voyager™.

Tissue_processing
Microscopy
Analysis
EXPERIENCED TEAM

OVER A DECADE OF DRUG
BIODISTRIBUTION EXPERTISE 

Vibraint's founding team built their expertise in drug biodistribution imaging at Novo Nordisk,
Gubra, and Lundbeck, including the GLP-1 brain mapping work that contributed to
Saxenda NDA qualification. That experience now powers LS-Journey™.

READY TO DESIGN YOUR WHOLE BRAIN STUDY WITH LS-JOURNEY™

Tell us your target markers, mouse model, sample numbers, and reporting needs, and our scientists will design the optimal module combination and provide a detailed quote.