MAP DISEASE PATHOLOGY ACROSS THE BRAIN. UNBIASED. QUANTITATIVE. 3D.
Visualise and quantify disease pathology in mouse models of Alzheimer's and Parkinson's diseases, neurodegeneration and neuroinflammation
iDISCO+ clearing · light sheet fluorescence microscopy · AI-assisted image analysis · CCF brain atlas registration · CNS-Voyager™ integration
TAKE THE TEST
FIND OUT IF WHOLE BRAIN IMAGING CAN ACCELERATE YOUR RESEARCH.
From tissue clearing and light sheet microscopy to spatial transcriptomics, single-cell sequencing and traditional immunohistochemistry, neuroscientists today have more tools than ever to study the brain. The challenge is no longer access to technology. It's knowing which approach will actually answer your research question. Each method has trade-offs in resolution, throughput, coverage and cost, and choosing the wrong one can mean months of work that misses the biology that matters most. Whole-brain imaging is transforming how researchers map activity, track drug distribution and uncover circuitry, but it's not the right fit for every question. Take the test to find out whether whole-brain imaging can accelerate your research.
WHY WHOLE BRAIN?
DISEASE PATHOLOGY IS NOT UNIFORMLY DISTRIBUTED. TARGET SAMPLING MISSES THE FULL PICTURE
Amyloid plaques, tau tangles, dopaminergic neuron loss, and microglial activation all have distinct, non-uniform spatial patterns across the brain. Choosing which regions to section before data collection introduces bias that can mask therapy effects, fail to identify the most affected regions, and lead to flawed go/no-go decisions.
Whole-brain LS-Journey™ imaging
-
All 800+ regions simultaneously
Unbiased, complete spatial map of pathology burden, across every anatomical area in one experiment -
AI-automated, reproducible quantification
Cell and plaque counts per anatomical region, observer-independent, consistent across cohorts and sites -
Multi-marker spatial co-registration
Amyloid, tau, neuroinflammation, and neuronal loss quantified and compared in the same CCF space -
Complete therapy efficacy readout
Regional drug effects captured across the entire brain, including unexpected responder and non-responder areas
Alzheimer's disease
Brain-wide quantification of Amyloid and tau pathology
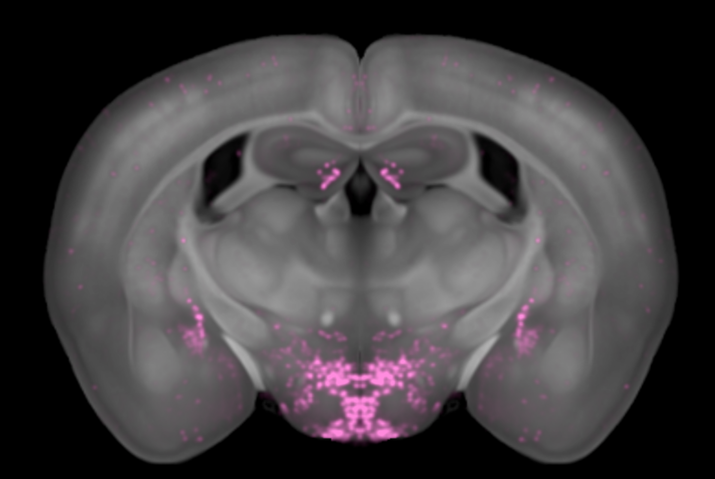
Alzheimer's disease is characterised by the progressive accumulation of beta-amyloid (Aβ) plaques and neurofibrillary tau tangles, accompanied by neuroinflammation and neuronal loss. In mouse models (5xFAD, APP/PS1, 3xTg-AD, AppNL-G-F), pathology does not distribute uniformly. It follows a stereotyped but complex spatial pattern that targeted sectioning reliably undersamples.
LS-Journey™ delivers the complete 3D distribution of amyloid plaque burden across all cortical layers, hippocampal subfields, and subcortical areas, enabling unbiased quantification of therapeutic effects, spatial correlation of amyloid with tau and neuroinflammation, and identification of the earliest affected regions for biomarker development.
Anti-amyloid therapy efficacy, target engagement (GLP-1R, TREM2, complement), and disease progression readouts can all be quantified brain-wide to generate the IND-enabling datasets required for regulatory submissions.
Compatible markers & applications
Amyloid pathology
Brain-wide Aβ plaque density and distribution. Plaque number, size distribution, and load per CCF region.
Tau pathology
Regional phospho-tau load and spatial co-registration with amyloid.
Neuronal loss & inflammation
Spatial correlation of neuronal loss with plaque and tangle density. Brain-wide microglial activation profiles.
Drug discovery applications
Anti-amyloid therapy efficacy · TREM2/microglial targeting · complement inhibition readout · tau propagation mapping · IND-enabling pathology burden data.
Parkinson's disease
Compatible markers & applications
Dopaminergic markers
Whole-brain quantification of dopaminergic neuron density in SNc, VTA, and locus coeruleus. Striatal TH-positive fibre density as a therapy efficacy readout.
Alpha-synuclein pathology
Brain-wide mapping of alpha-synuclein aggregate distribution and spread following PFF injection or in transgenic models.
Neuroinflammation
Spatial microglial and astrocyte activation co-registered with dopaminergic neuron loss and aSyn aggregates in the same CCF reference space.
Drug discovery applications
Neuroprotection efficacy · aSyn targeting validation · striatal reinnervation assessment
Brain-wide dopaminergic neuron loss and alpha-synuclein distribution.
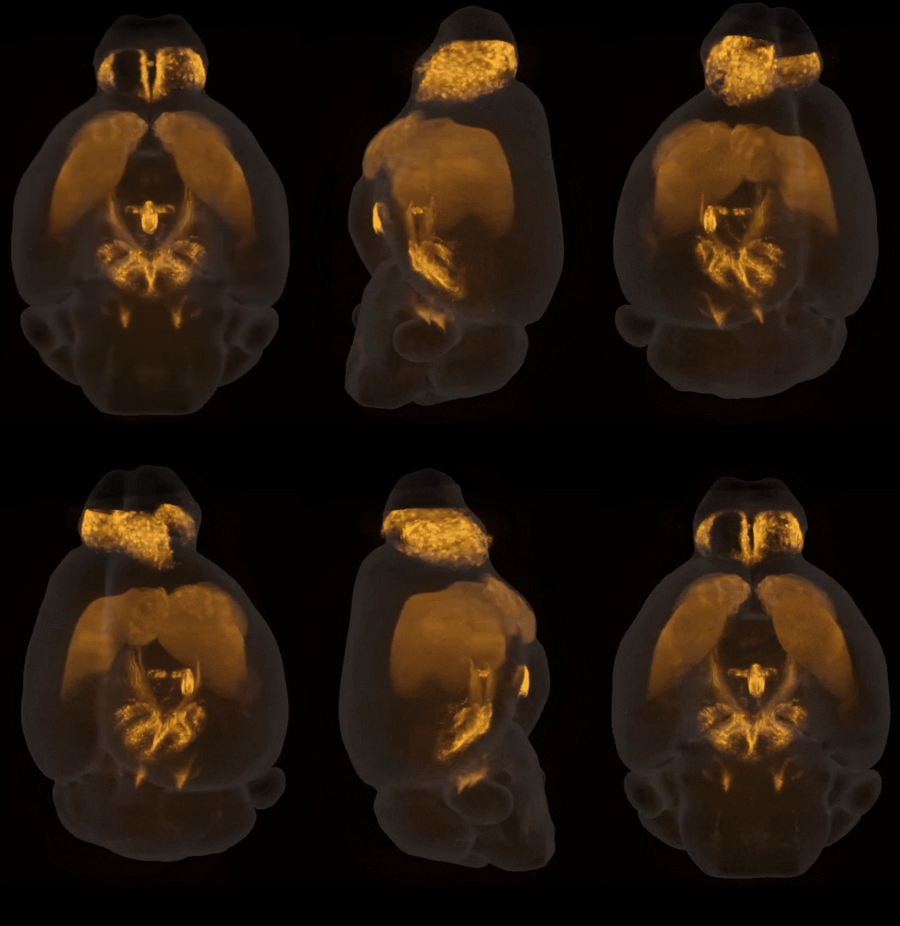
Parkinson's disease involves the progressive degeneration of dopaminergic neurons, primarily in the substantia nigra pars compacta (SNc), with accompanying accumulation of alpha-synuclein aggregates and neuroinflammation. In MPTP, 6-OHDA, and aSyn PFF mouse models, the spatial extent of neurodegeneration extends well beyond the SNc, into the VTA, locus coeruleus, and cortical dopaminergic projections.
LS-Journey™ quantifies TH-positive neuron density and axonal fibre loss across the full brain, including striatal dopaminergic innervation, which is critical for assessing neuroprotective therapy efficacy. Alpha-synuclein (aSyn) and phospho-Ser129-aSyn aggregate distribution can be mapped simultaneously, revealing the spatiotemporal spread of pathology across the brain.
This approach provides the complete spatial readout of dopaminergic degeneration and aSyn pathology that SNc stereology alone cannot deliver.
Stroke & ischaemia
3D infarct volume and remote degeneration
Stroke creates a complex, spatially heterogeneous pattern of injury, an ischaemic core of irreversible neuronal death, surrounded by a penumbra of potentially salvageable tissue, with secondary neurodegeneration and neuroinflammation extending to regions remote from the primary lesion.
LS-Journey™ delivers true volumetric 3D quantification of infarct size and morphology using the autofluorescence channel or NeuN immunostaining, replacing 2D infarct area measurements from coronal sections with a complete spatial reconstruction of the lesion. Peri-infarct microglial activation (Iba1) and bilateral thalamic degeneration can be simultaneously mapped and co-registered in the same CCF space.
This approach captures the full impact of stroke on the brain, including remote diaschisis and secondary neuroinflammation, which is systematically missed by targeted histology.
Compatible markers & applications
Infarct and neuronal loss
3D volumetric infarct core quantification. Penumbra boundary mapping. Remote secondary degeneration in thalamus, substantia nigra, and contralateral cortex.
Vascular and inflammatory response
Brain-wide microglial activation and reactive astrogliosis maps. Vascular remodelling in the peri-infarct zone.
Drug discovery applications
Neuroprotective therapy efficacy · infarct volume reduction quantification · vascular intervention readouts · anti-inflammatory drug effects · remote degeneration prevention.
Neuroinflammation
Compatible markers & applications
Microglial markers
Brain-wide microglial density quantification per CCF region. Homeostatic vs activated microglial state mapping. Comparison between treatment and control cohorts across the full brain.
Drug discovery applications
TREM2/CSF1R agonist readouts · complement inhibitor efficacy · anti-neuroinflammatory drug profiling · unexpected off-target CNS inflammation detection · EAE and LPS model characterisation.
BRAIN-WIDE MICROGLIA ACTIVATION
Neuroinflammation is a component of virtually every CNS disease, from acute insults (LPS, EAE) to chronic neurodegeneration. Microglial activation does not occur uniformly; it follows spatial patterns that reflect the underlying pathology, route of insult, and disease progression stage.
LS-Journey™ delivers whole-brain Iba1 mapping for microglial counts and density across all 800+ anatomical regions simultaneously. This approach identifies brain regions of unexpected neuroinflammation, reveals the relationship between inflammation and neuronal loss, and provides a complete spatial readout of anti-inflammatory drug efficacy.
For CNS drug programmes targeting microglia (TREM2, CSF1R, complement), LS-Journey™ provides the brain-wide target engagement and pharmacodynamic readout that targeted sectioning cannot deliver.
FREQUENTLY ASKED QUESTIONS
WHAT PHARMA AND BIOTECH TEAMS ASK ABOUT BRAIN-WIDE DISEASE PATHOLOGY IMAGING
How does whole brain imaging quantify amyloid plaque burden in Alzheimer's disease mouse models?
Whole brain iDISCO+ clearing with anti-amyloid antibodies and light sheet microscopy visualises amyloid plaques throughout the intact brain in 3D. AI signal segmentation detects and quantifies individual plaques, while CCF registration maps plaque density to all 800+ anatomical regions simultaneously, capturing the full spatial distribution of amyloid pathology, including cortical layers, hippocampal subfields, and subcortical areas, without sampling bias.
What markers quantify dopaminergic neuron loss in Parkinson's disease models?
Tyrosine hydroxylase (TH) is the primary marker for dopaminergic neuron quantification. Whole-brain TH imaging with LS-Journey™ quantifies neuron density in the substantia nigra pars compacta (SNc), ventral tegmental area (VTA), and locus coeruleus, as well as TH-positive fibre density in the striatum and cortex. Alpha-synuclein (aSyn) and phospho-Ser129-aSyn can be co-stained to map aggregate distribution brain-wide in MPTP, 6-OHDA, and aSyn PFF models.
Can LS-Journey™ measure 3D infarct volume in stroke mouse models?
Yes. NeuN immunostaining or autofluorescence can be combined with whole-brain light sheet imaging to provide true 3D volumetric quantification of infarct core in tMCAO and pMCAO, replacing 2D infarct area measurements from coronal sections. Peri-infarct microglial activation (Iba1), remote thalamic degeneration, and bilateral neuroinflammation are simultaneously mapped in the same CCF space.
How is brain-wide neuroinflammation mapped and quantified?
Whole-brain Iba1 (microglia) immunostaining with iDISCO+ clearing and light sheet microscopy quantifies neuroinflammation across all 800+ CCF regions simultaneously. AI cell detection counts Iba1-positive cells per region, producing spatial maps of microglial activation and density. Co-registration with neuronal loss markers and disease pathology markers in the same CCF space enables direct spatial correlation analysis.
Which mouse models are compatible with LS-Journey™ disease pathology studies?
LS-Journey™ is compatible with Alzheimer's models (5xFAD, APP/PS1, 3xTg-AD, AppNL-G-F), Parkinson's models (MPTP, 6-OHDA, aSyn PFF, LRRK2 transgenic), stroke models (tMCAO, pMCAO, ET-1), neuroinflammation models (LPS, EAE), and disease-specific transgenic lines. Contact Vibraint to confirm suitability for your specific model and marker combination.
How does whole brain pathology imaging compare to ELISA for amyloid quantification?
ELISA quantifies bulk amyloid in homogenised tissue, losing all spatial information. Whole-brain LS-Journey™ imaging preserves the complete 3D spatial distribution of pathology, enabling regional analysis, identification of the earliest affected areas, and co-registration with other markers. Both are complementary; LS-Journey™ is uniquely suited for spatially-resolved questions, including regional drug efficacy.
Can LS-Journey™ detect regional vulnerability and disease progression in neurodegeneration?
Yes. Because LS-Journey™ quantifies pathology across all 800+ CCF regions simultaneously, it identifies which anatomical areas show earliest or most severe pathology, without pre-selecting regions. Longitudinal studies comparing disease progression time points generate spatial maps of pathology spread. Voxel-wise group comparisons between treatment and control cohorts produce statistical maps of drug efficacy across the entire brain volume.
Are IND-enabling regulatory reports available for disease pathology studies?
Yes. IND-enabling regulatory reports formatted for FDA and EMA submissions are available as an add-on to any LS-Journey™ disease pathology study. These include systematically structured quantitative pathology data, complete methodology documentation, QC records, statistical analysis, and audit trails. They are suitable for inclusion in Investigational New Drug applications for CNS drug programmes. Specify at quote stage and Vibraint will confirm regulatory formatting requirements for your specific programme.
VIBRAINT'S LS-JOURNEY™ PLATFORM
LS-Journey™ is purposely designed to be modular. This way you can customise your studies as you wish. If you do the staining and microscopy, we can analyse the data and upload to CNS-Voyager™.



READY TO DESIGN YOUR WHOLE BRAIN STUDY WITH LS-JOURNEY™
Tell us your target markers, mouse model, sample numbers, and reporting needs, and our scientists will design the optimal module combination and provide a detailed quote.