whole-brain imaging
CCF
Brain atlas
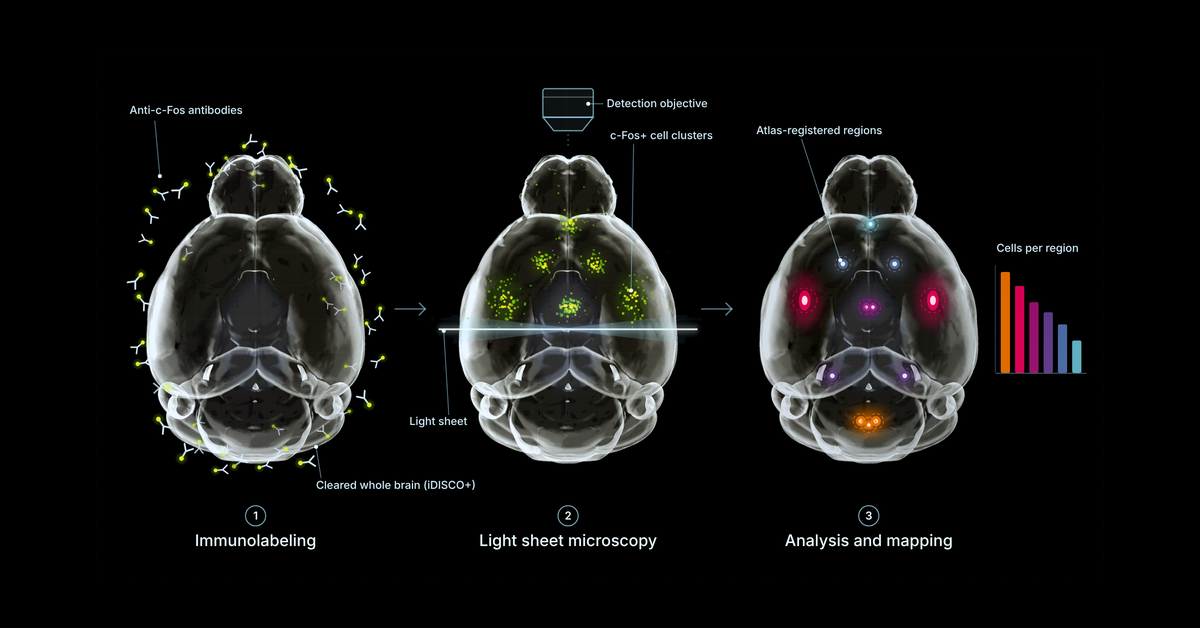

Whole-brain c-Fos mapping is a method for finding out which neurons were activated, anywhere in the mouse brain, after a drug, a stimulus or a behavior. c-Fos is an immediate early gene, and its protein accumulates in neurons within roughly one to two hours of activation. Whole-brain c-Fos mapping combines whole-brain immunolabeling, light sheet microscopy and registration to a 3D brain atlas to detect and count c-Fos-positive cells across the entire intact brain at once, unbiased across 800+ annotated regions, rather than in a few hand-picked regions of interest.
This post explains what c-Fos does and does not measure, how the pipeline works step by step, how it compares to fMRI, and what the method is used for in drug discovery and basic neuroscience.
c-Fos is a marker of recent neuronal activation. When a neuron fires strongly enough, the c-fos gene is transcribed rapidly, and the protein becomes detectable within about 30 to 60 minutes, peaks at roughly 60 to 120 minutes and returns toward baseline within a few hours. Fixing the brain inside that window captures a snapshot of which cells responded to whatever happened shortly before.
That snapshot has clear limits, and they shape how a study should be designed:
Timing is the variable that matters most. For a drug study, the right moment to collect brains depends on the compound's pharmacokinetics: collect too early and the c-Fos response has not built up, collect too late and it has already faded. As Jacob Hecksher-Sørensen, CEO and co-founder of Vibraint, put it in our product series:
"Because it is a marker that goes up and then disappears, you don't want to wait too long, and you don't want to look too early. So there's a little bit of discussion in how you design your study, and I would always recommend that we do that first."
Fos vs. c-Fos: Fos refers to the protein family. c-Fos is specifically the product of the c-fos immediate early gene, and it is the member most widely used to visualize recent neuronal activation because it is induced quickly and reliably across most neuron types.
The general technique has four stages. Each one can be run on its own or combined into a single end-to-end study.
The intact brain is stained with an anti-c-Fos antibody and made optically transparent, most commonly with the iDISCO+ protocol. This is the slowest step, and its duration does not depend much on study size, because antibodies need time to penetrate the whole tissue evenly. In Jacob's words: "Whether you have one brain or a hundred brains, it will take a month, just to allow the antibodies to penetrate into the tissue and have uniform, nice labeling." Learn more about whole-brain immunolabeling.
The cleared brain is imaged in 3D with a light sheet microscope at cellular resolution. Scanning one brain takes roughly one to two hours depending on the number of labels, and produces around 1 TB of raw data. Unlike the immunolabeling step, imaging time scales linearly with the number of brains. See the light sheet imaging step.
Individual c-Fos-positive cells are detected automatically, and each brain is registered to a 3D reference atlas so every cell can be assigned to an anatomical region. This is where most of the practical difficulty lies: datasets of this size are hard to move, store and process, which is why analysis is often the bottleneck for labs that already own a light sheet microscope.
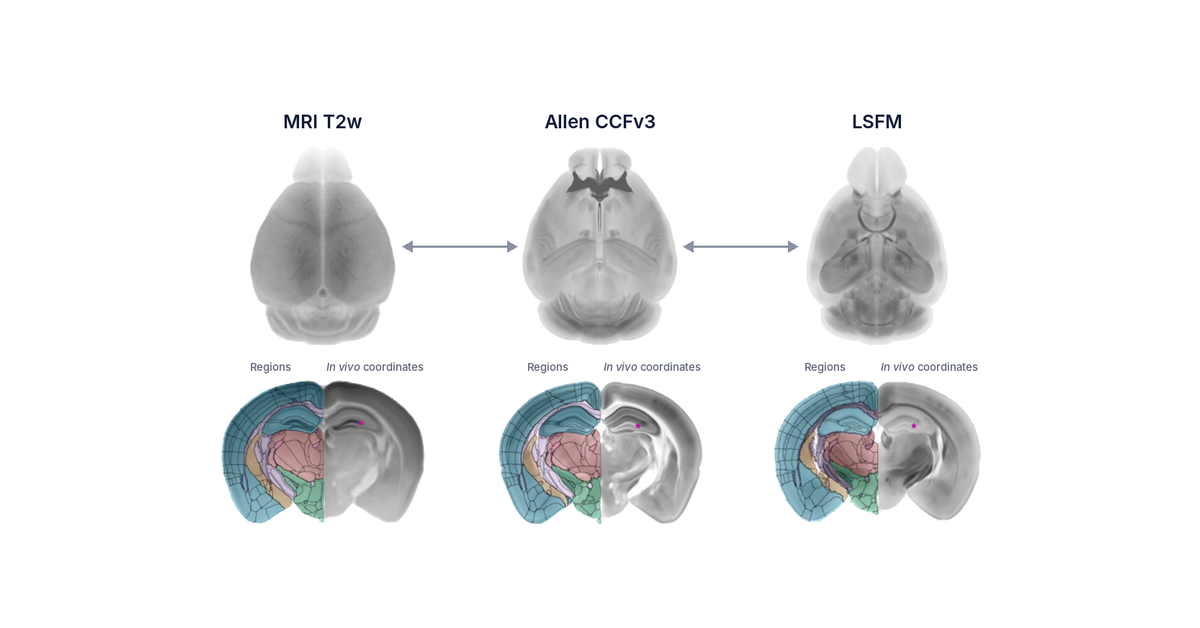
Atlas choice matters for accuracy. The Perens light sheet reference atlas was built from 139 iDISCO+ brains imaged with light sheet microscopy, so it matches the shape of cleared tissue. In the original publication, registering semaglutide-induced c-Fos data to the standard Allen CCFv3 instead assigned part of the hindbrain signal to the dorsal motor nucleus of the vagus (DMX) rather than the nucleus of the solitary tract (NTS) (Perens et al. 2021, Neuroinformatics). Read about AI-assisted image analysis.
For many projects the quantitative data and 3D maps are the deliverable. When a formal study report is needed, for example for an internal decision or a regulatory package, it is written after the data has been reviewed, so the report can focus on the regions that turned out to matter.
At Vibraint, these four stages make up LS-Journey™. A typical full-pipeline study takes around two to two and a half months from the day brains arrive in our lab to the day the data is live on CNS-Voyager™, with about one month of that spent on immunolabeling. Brains are QC-checked on arrival, and each move to a new step (lab processing, microscopy, analysis, upload) is communicated as it happens. Labs that already have their own light sheet data can use the analysis module on its own.
Whole-brain c-Fos mapping and fMRI both describe brain activity, but they measure different things at very different scales. They are better thought of as complementary than as competing methods.
| Whole-brain c-Fos mapping | fMRI | |
|---|---|---|
| What is measured | A protein marker of recent neuronal activation, fixed in tissue | Blood-oxygen-level-dependent (BOLD) signal, an indirect proxy for activity |
| Spatial resolution | Single cell, across the whole brain | Voxels containing many thousands of cells |
| Time | One snapshot of a 1 to 2 hour window | Real time, repeatable in the same subject |
| Typical species | Mouse (and other rodents) | Human; possible in rodents but technically demanding |
| Main tradeoff | Requires terminal tissue collection | Longitudinal and in vivo, but coarser and harder to perform in mice |
If the question is "which cells, in which nuclei, responded to this compound?", c-Fos gives the more precise answer. If the question is "how does activity change over time in the same individual?", fMRI is the method that can follow it. A natural next step for translational programs is to use both: whole-brain c-Fos in mice to identify the responding circuits at cellular resolution, and imaging in larger species or humans to test whether the same regions respond.
Because no regions need to be selected in advance, the method is most useful when the answer may sit somewhere unexpected.
Whole-brain imaging data has also carried regulatory weight before. Whole-brain biodistribution mapping by Vibraint's founders at Novo Nordisk supported the NDA for Saxenda (liraglutide), the first FDA-approved peptide-based obesity drug.
For audience-specific detail, see c-Fos in preclinical drug discovery and whole-brain c-Fos for discovering new biology.
A single c-Fos brain contains cell counts for 800+ regions, plus the 3D position of every detected cell. A static report can show only a fraction of that. Jacob described the limitation of the old delivery format directly:
"Previously we've been making reports and PowerPoint presentations, but it always limits you to look at maybe 10 or 20 brain regions, and maybe you didn't look at exactly the right section. Here, because you can scroll through the brain in any dimension you want, you can look up any brain region you want."
This is why LS-Journey™ data is delivered on CNS-Voyager™ rather than as a file transfer. In the viewer you can open, for example, the arcuate nucleus of the hypothalamus, see the number of c-Fos-positive cells per animal in that region, and link those counts to the exact 3D positions of the cells. Data stays private to your study, collaborators can be invited into the same protected workspace, and figures, images, movies and plots can be exported for publications or reports.
Your own maps can also be viewed alongside public datasets in the same atlas space, including Allen Brain connectivity, spatial transcriptomics, whole-genome ABC Atlas gene expression maps and published c-Fos datasets. Combining activity with connectivity and gene expression in one coordinate system is what we call integrative spatial biology.
CNS-Voyager™ is built on the same peer-reviewed Perens CCF reference brain described above, and it is open to any neuroscientist by subscription, with a reduced tier for PhD students. It is a direct way to see what whole-brain c-Fos data looks like before designing a study. Browse c-Fos data on CNS-Voyager™.
Whole-brain c-Fos mapping detects and counts c-Fos-positive neurons across the entire mouse brain at once, using whole-brain immunolabeling, light sheet microscopy and registration to a brain atlas. Because c-Fos is an immediate early gene expressed after neuronal activation, it reveals which of 800+ annotated brain regions were active after a stimulus, behavior or drug treatment, without selecting regions of interest in advance.
c-Fos protein typically becomes detectable within 30 to 60 minutes of neuronal activation, peaks around 60 to 120 minutes and returns to baseline within a few hours. This narrow window is why the timing of tissue collection relative to the stimulus is one of the most important variables in a c-Fos study.
Fos is the protein family. c-Fos specifically refers to the protein product of the c-fos immediate early gene, which is the marker most commonly used to visualize recent neuronal activation because it is induced rapidly and reliably across most neuron types.
Whole-brain c-Fos mapping gives single-cell resolution across the entire mouse brain but requires terminal tissue collection at one time point. fMRI measures blood-oxygen-level-dependent signal in real time and can be repeated in the same living subject, at much coarser spatial resolution. The two techniques are complementary.
c-Fos is a marker of recent neuronal activation. Its presence indicates that a neuron was strongly activated and transcribed the c-fos gene within roughly the prior one to two hours. It does not directly indicate inhibition, sustained activity outside that window, or activation in every cell type at equal sensitivity.
A full-pipeline study typically takes around two to two and a half months from sample receipt to data delivery. About one month is needed for whole-brain immunolabeling regardless of the number of brains, because antibodies need time to penetrate the intact tissue evenly. Imaging takes roughly one to two hours per brain, followed by automated analysis and atlas registration.
Study design, especially the timing of tissue collection, decides what a c-Fos map can show. We work with academic, biotech and pharma teams in Europe, the US, the UK and Australia, and we start every c-Fos study with a design discussion. Explore LS-Journey™ or explore the data live on CNS-Voyager™.